Boxcar Trade
Introduction
We want to present the Boxcar trade, which we consider a good starting point for income strategy development. The trade was originally developed by Dan Harvey and presented multiple times by various lecturers at Aeromir Corporation.
This article summarizes the trade specifics shown in the video. Some trade rules seem to be slightly different in the Example Trade vs. on the Trade Guidelines slides (both are presented in the video). In such cases, our analysis is based on the Example Trade.
Full disclosure: We are not affiliated, associated, authorized, or endorsed by Aeromir. The information shown in this blog post is for informational purposes only and shouldn’t be taken as investment advice.
Trade rules
Based on the entry rules shown in the video, we came up with the following trade plan:
We will be trading SPX options and entering every Thursday or Friday and keep the position open for 7 days at most. Our planned capital is $25k per 10 lot trade, and we backtest more than 3.5 years to ensure that multiple market conditions are covered: grind up (2019 and 2021), crashing (2020), and sideways (2022).
As described in the guidelines, the Boxcar trade consists of a Put Credit Spread (pcs) and a Put Debit Spread (pds) at 8 DTE expiration. The four legs of the trade are defined as follows:
pcs_short
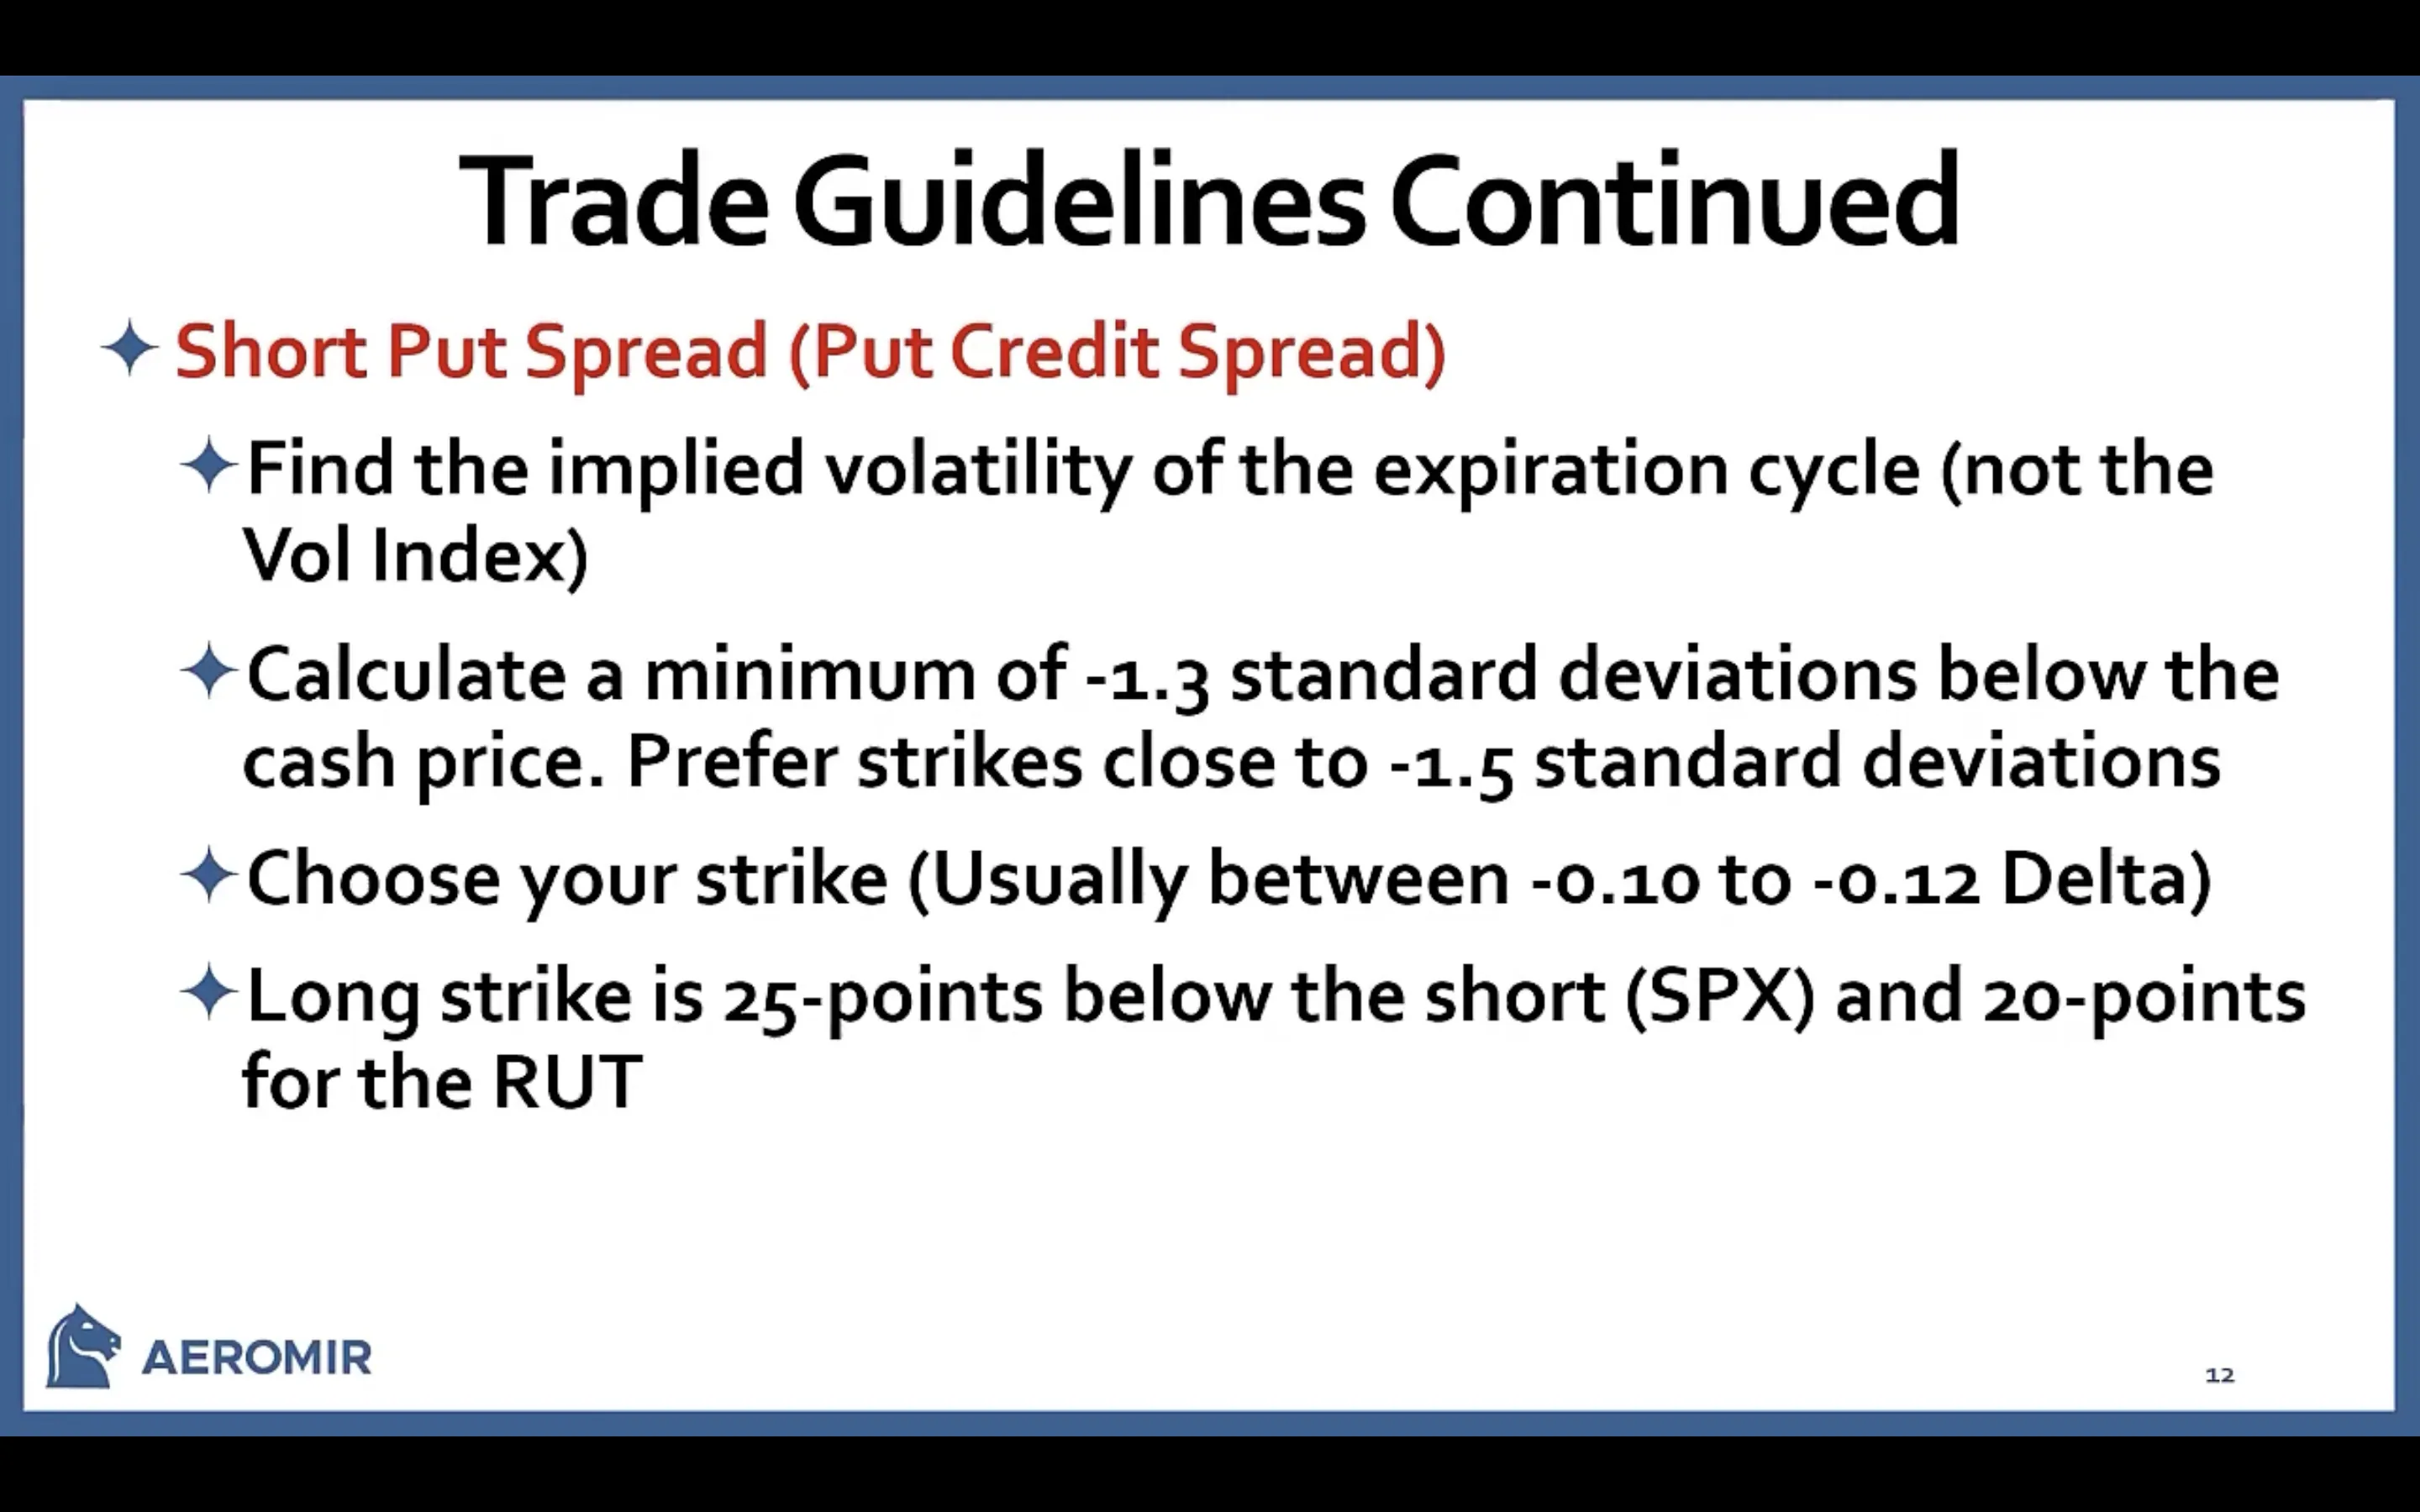
-10 @ Strike located at 10-12 delta. (First slide, third bullet)
In MesoSim we define this with the Delta StrikeSelector:
"Delta": "10"
pcs_long
+10 @ Strike 25 points below the pcs_short. (First slide, fourth bullet)
The relative strike can be specified using the StrikePrice StrikeSelector (called Statement in earlier versions):
"StrikePrice": "leg_pcs_short_strike - 25"
pds_long
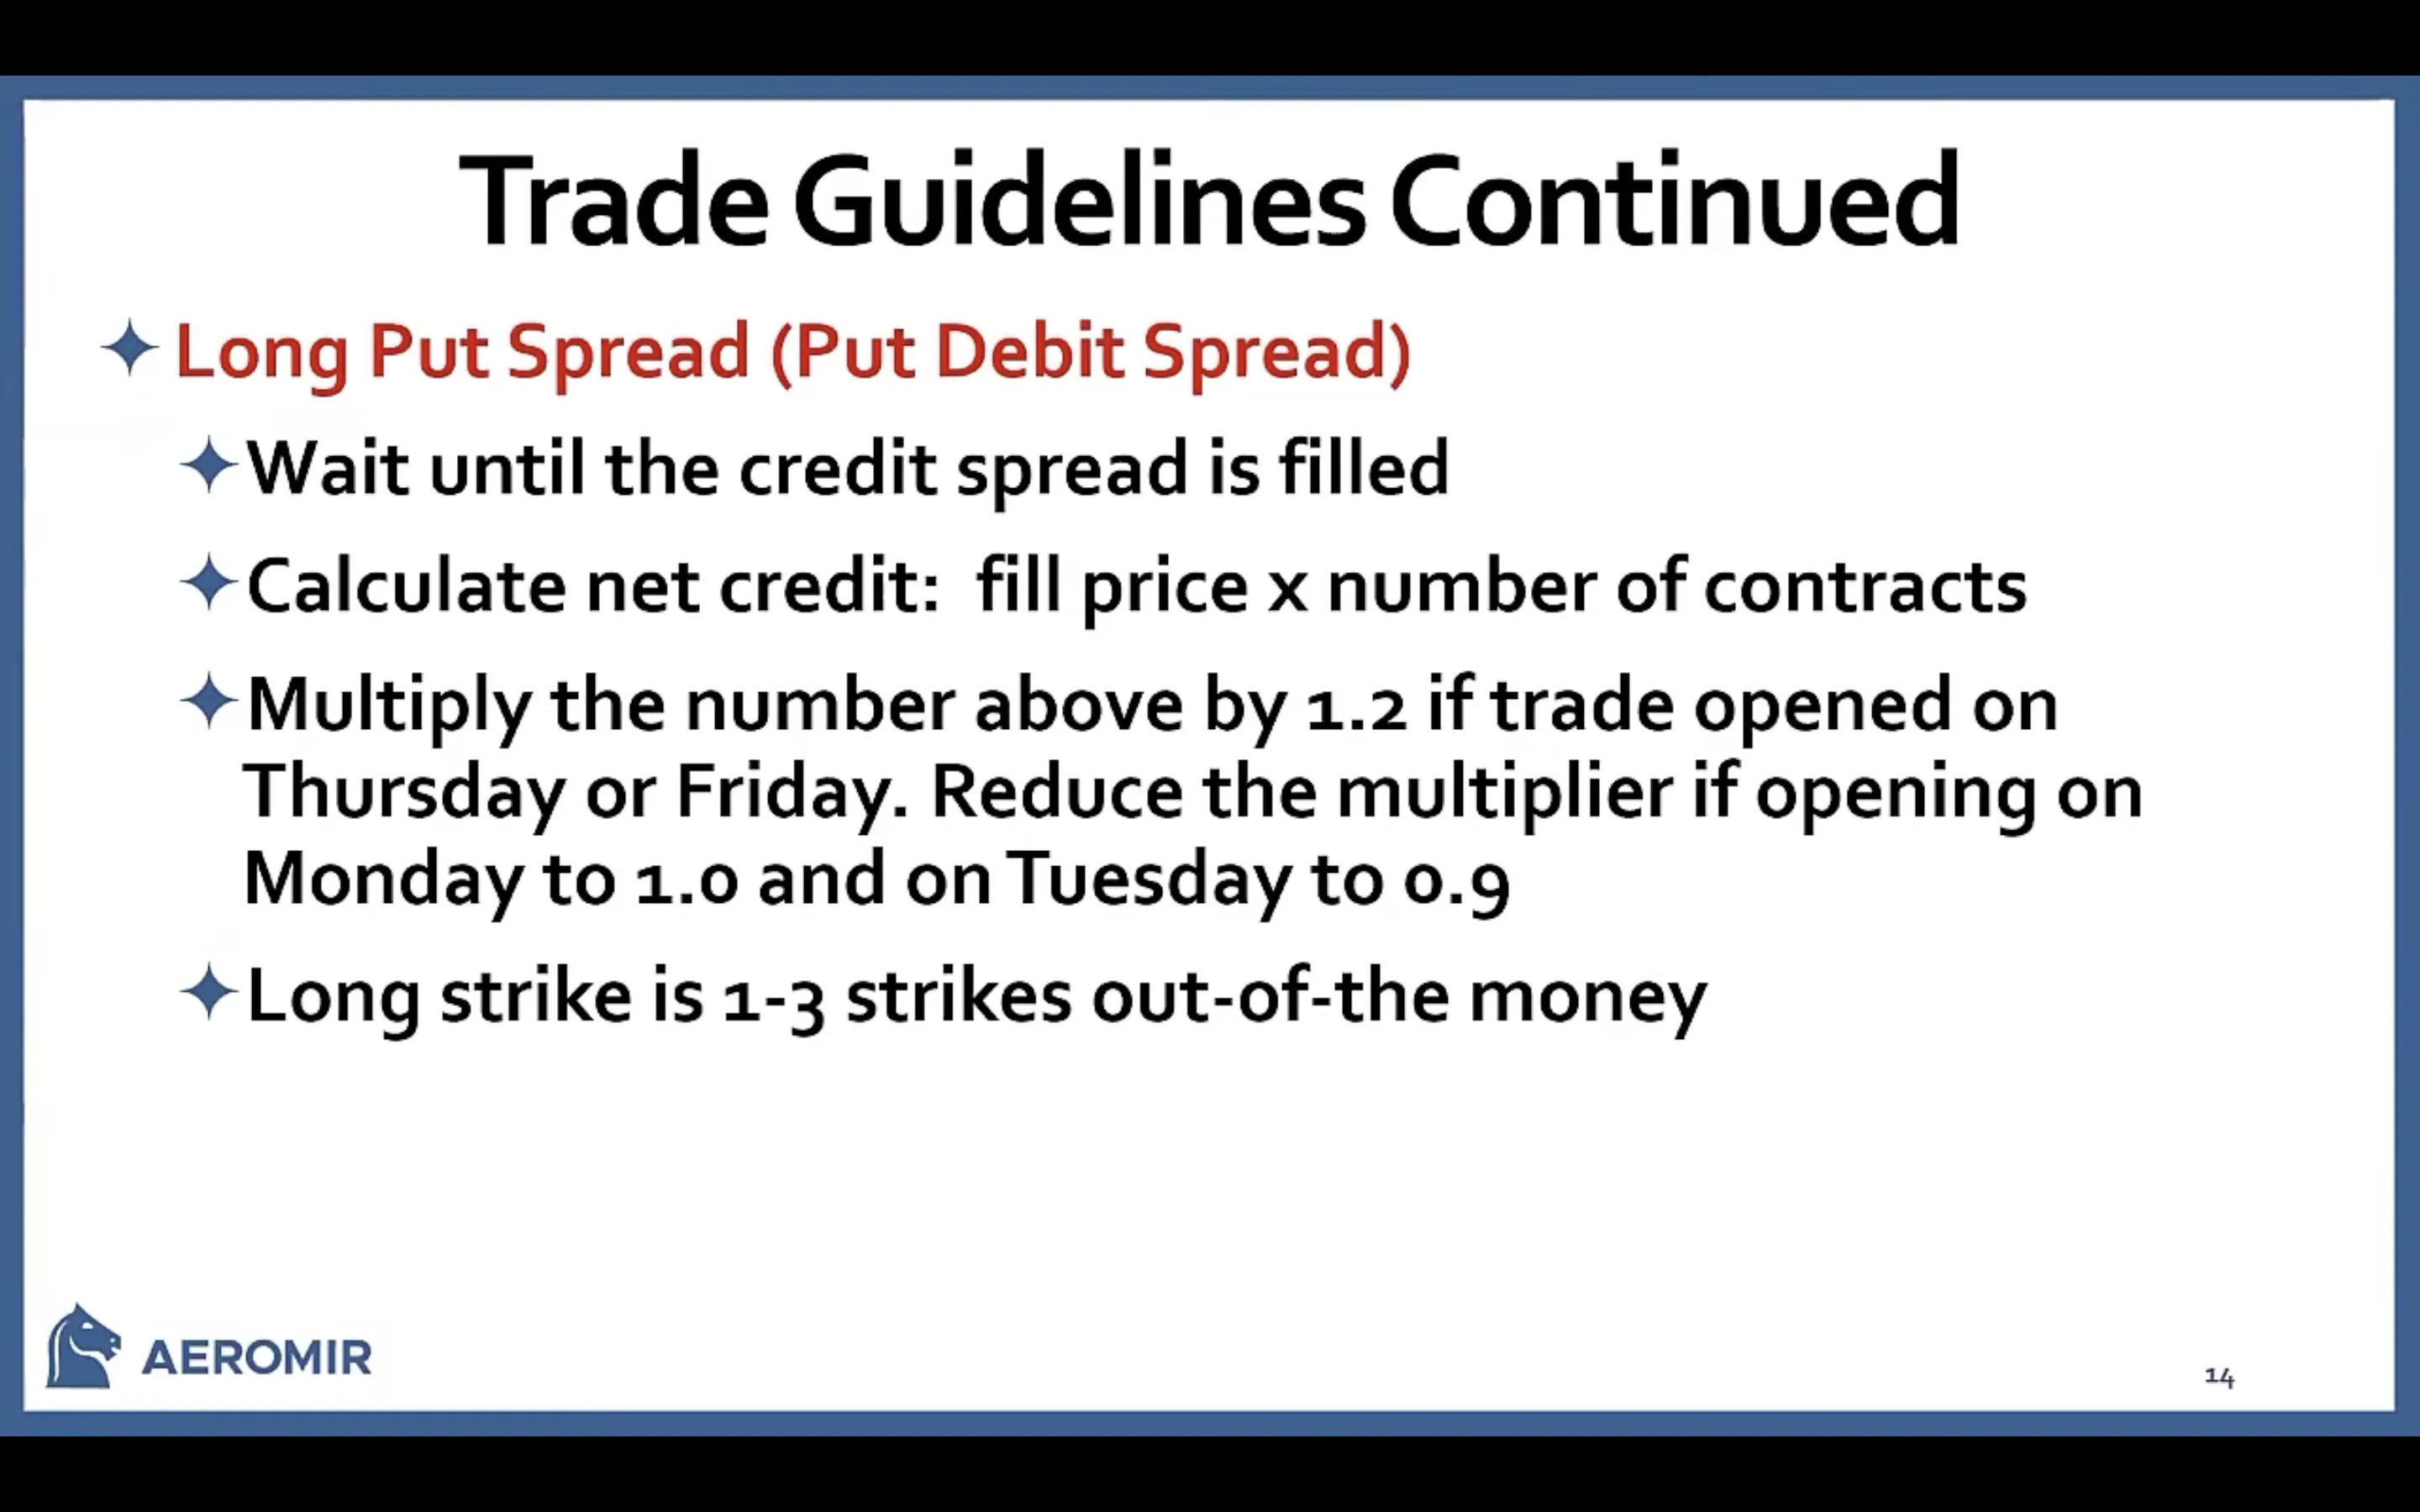
+1 @ 1 to 3 strikes Out Of the Money. (Second slide, fourth bullet)
To calculate N strike out of the money, we need to consider that SPX has strikes defined every $5. To find the nearest strike, we divide the current SPX Price (underlying_price variable) with $5, then round it down to the nearest integer with the floor() function. Then, multiply it back by five to end up at a valid strike. Going one strike out of the money means simply subtracting the strike increment (5) from the calculation:
"StrikePrice": "floor(underlying_price/5)*5 - 1 * 5"
pds_short
-1 @ Strike selected so that the overall position delta equals the number of lots traded (10).
To specify a strike based on Delta, we use the same strike Delta-based Strike Selector that we have used at pcs_short leg. MesoSim provides the pos_delta variable, representing the position we have built so far. At the point of evaluation, we have the pcs_short, pcs_long, and pds_long legs in the position. Therefore pos_delta represents their cumulative delta. If we would like to end up at 10
delta, we need to take the current delta accumulated so far (pos_delta), multiply it by -1 to end up at 0 delta, and add 10:
 -1 * pos_delta + 10 = 10 - pos_delta
"Delta": "10 - pos_delta"
To better understand how pds_short is calculated please refer to the Delta Hedging section of our documentation.
The full definition of the trade can be studied via the Run’s Strategy Definition tab.
Please refer to our documentation to get a better understanding of what each section and field represents.
Adjustments
The Boxcar trade comes with a handful of adjustment rules which are not too exact (or, in other words: somewhat discretionary). It's our experience that trades with numerous adjustment rules are much more complex to manage than slap-on/slap-off types of trades.
Therefore, we are not aiming to replicate the adjustment rules in this article fully but to develop a baseline that correctly replicates the entry. Then we will use this baseline in follow-up posts to tune and optimize the trade.
Backtest Results
Putting the trade rules into MesoSim results in the following run: https://mesosim.io/backtests/b736250e-ab35-4e92-835f-47e763cc460c
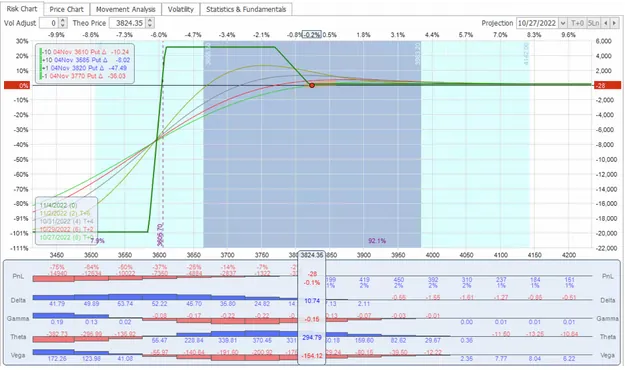
Using MesoSim’s Export to OptionNet Explorer functionality, it is easy to load the run into OptionNetExplorer and validate that the simulated trade matches the original structure described in the video:
Analysis
This section will analyze the backtest result and identify optimization opportunities to improve performance and reduce downside risk. On the OptionNet Explorer’s chart, we can see that we have relatively flat T+x lines if the price of the underlying remains the same or goes higher. In case of a large down move, the structure will gain a significant amount of delta.
Equity Graph
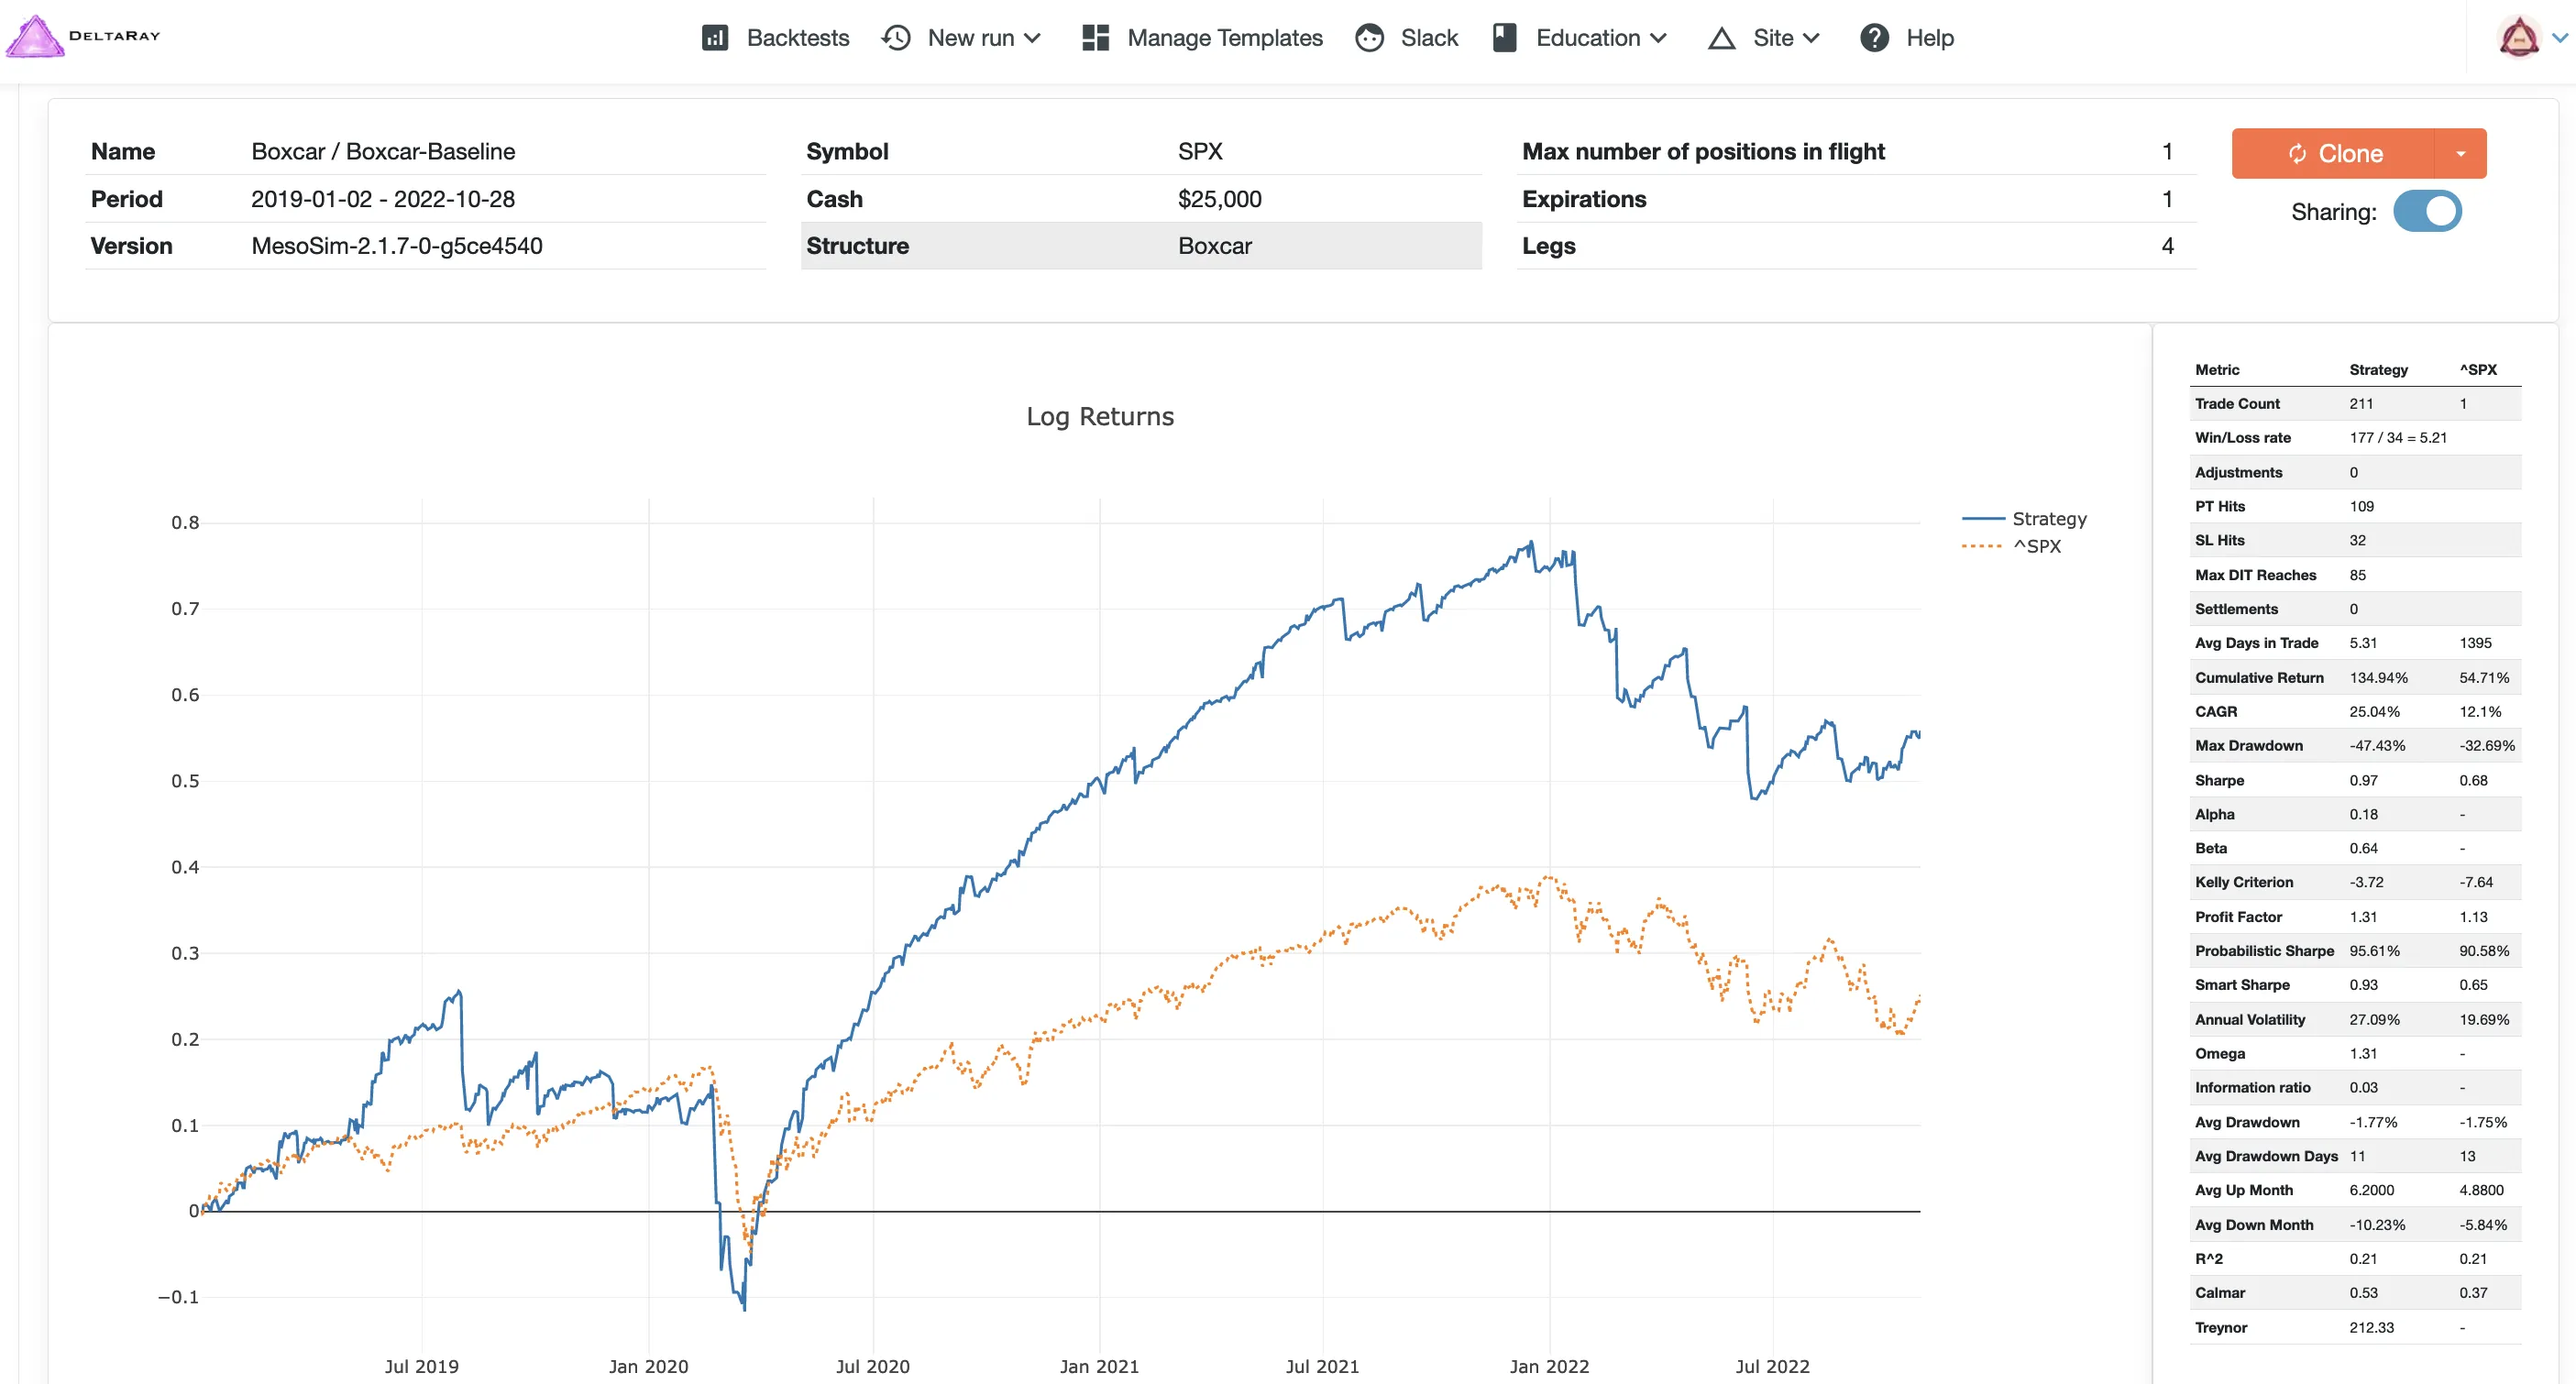
The (log-based) equity graph shows that the strategy outperforms the SPX buy-and-hold strategy. It is easy to notice that this strategy suffers during the COVID crash and doesn’t perform well when the market moves sideways (2022).
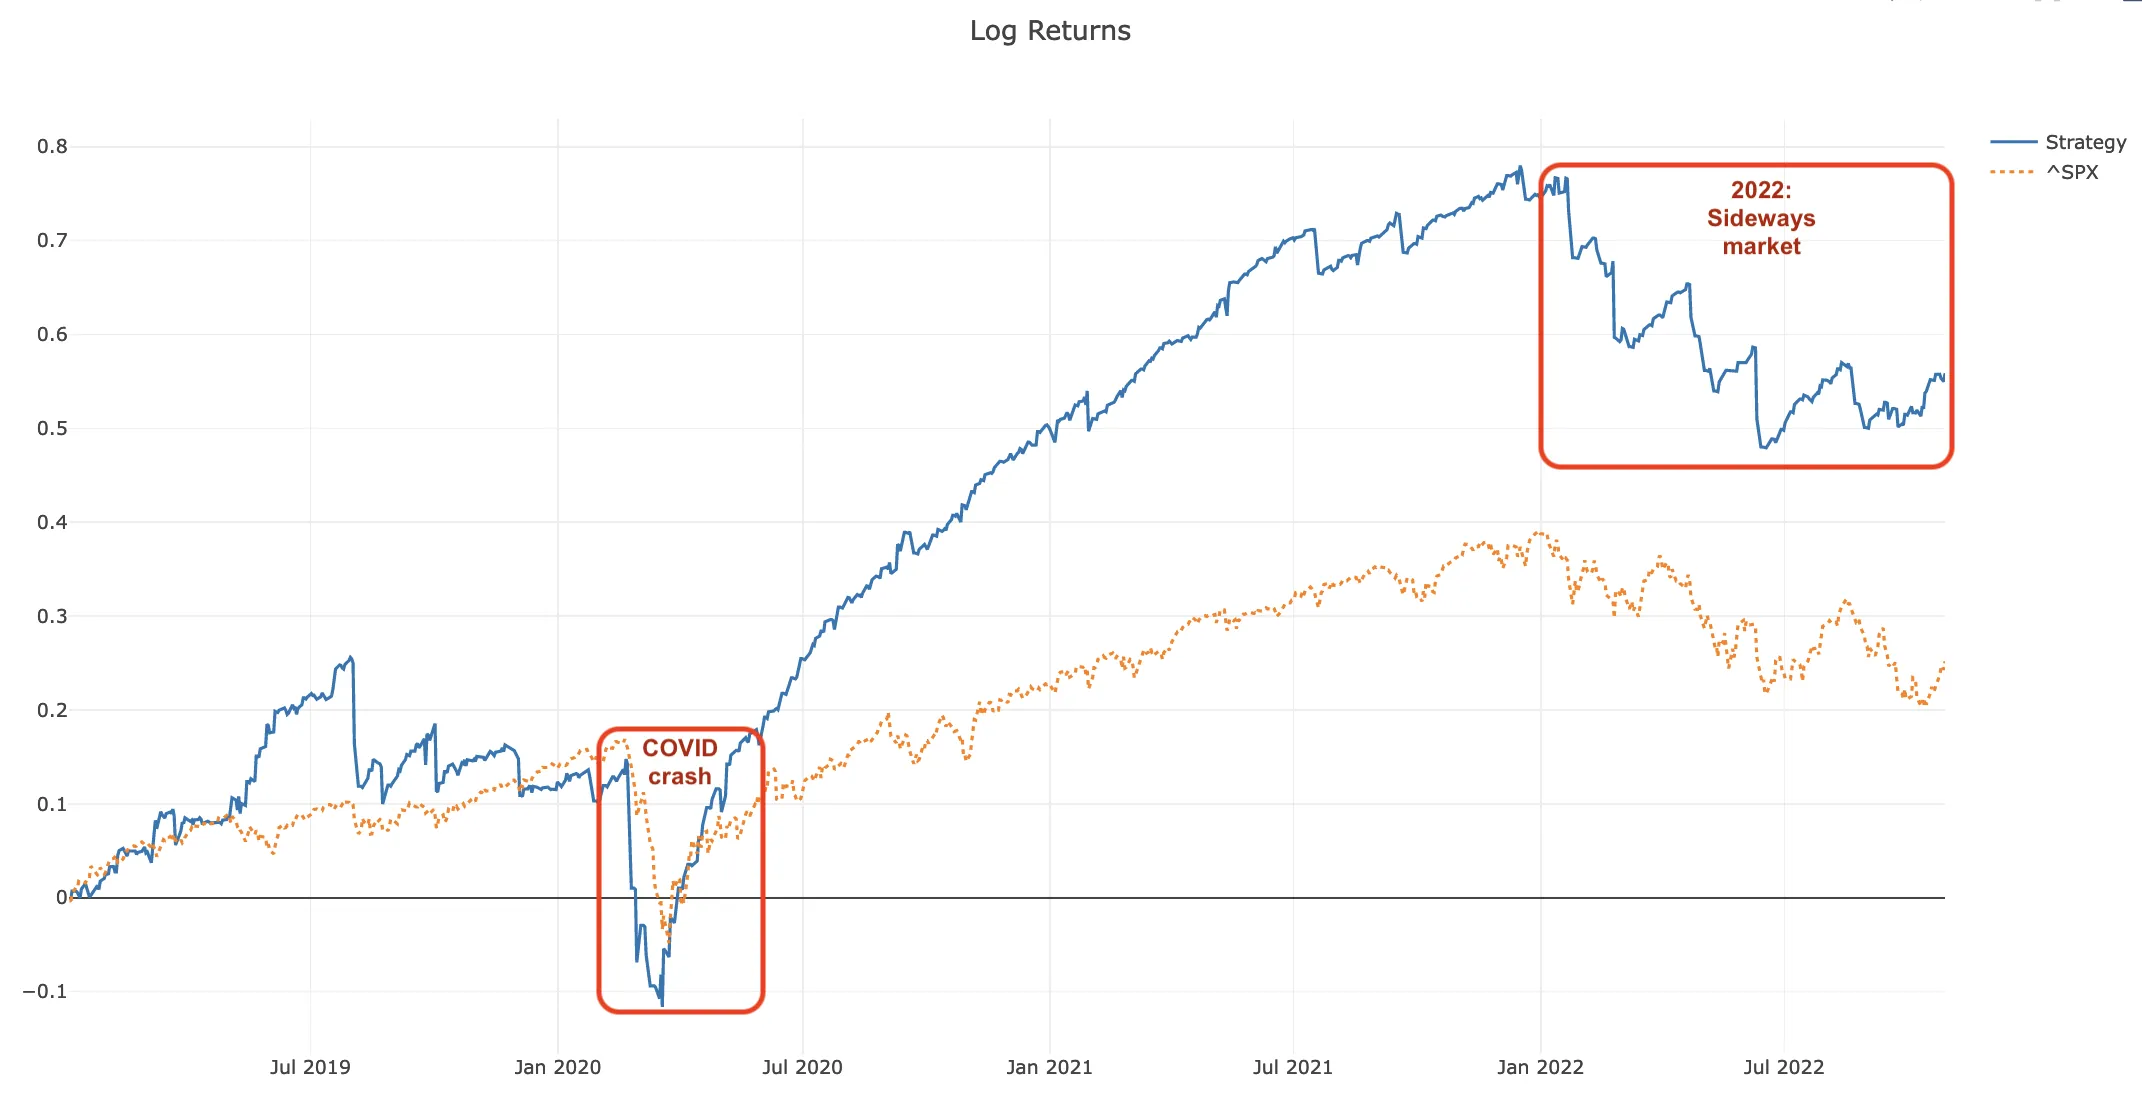
Certain market regimes can be identified (and therefore filtered) using the underlyings’ IV Rank or Percentile.
Metrics
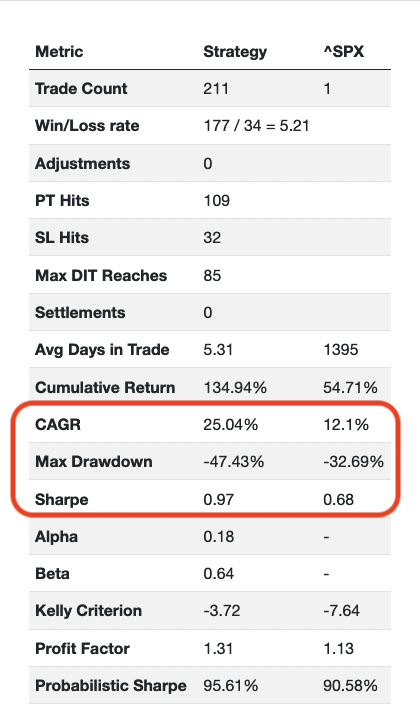
Based on the Sharpe ratio of 0.97, we can conclude that the trade performs better than the simple buy and hold of SPX for the given period in terms of risk-adjusted return. Note that a Sharpe ratio above 1 can be considered adequate; above 1.5 is good, while above 2.5 can be considered excellent.
The CAGR and the Max Drawdown are higher than the buy and hold strategy. The Max Drawdown for this slap-on/slap-off version of Boxcar is almost -50%. We believe that with proper adjustments, the Max Drawdown would improve.
Greeks
Delta
Delta describes the rate of change between the underlying and the option’s price.
The Account Greeks chart confirms that the 10 lot trade is opened at 10 delta, which the video suggests. The delta values deviating far from the initial value are happening due to notable moves on the underlying. The more SPX moves in one direction, the further it drives our delta from the starting point.
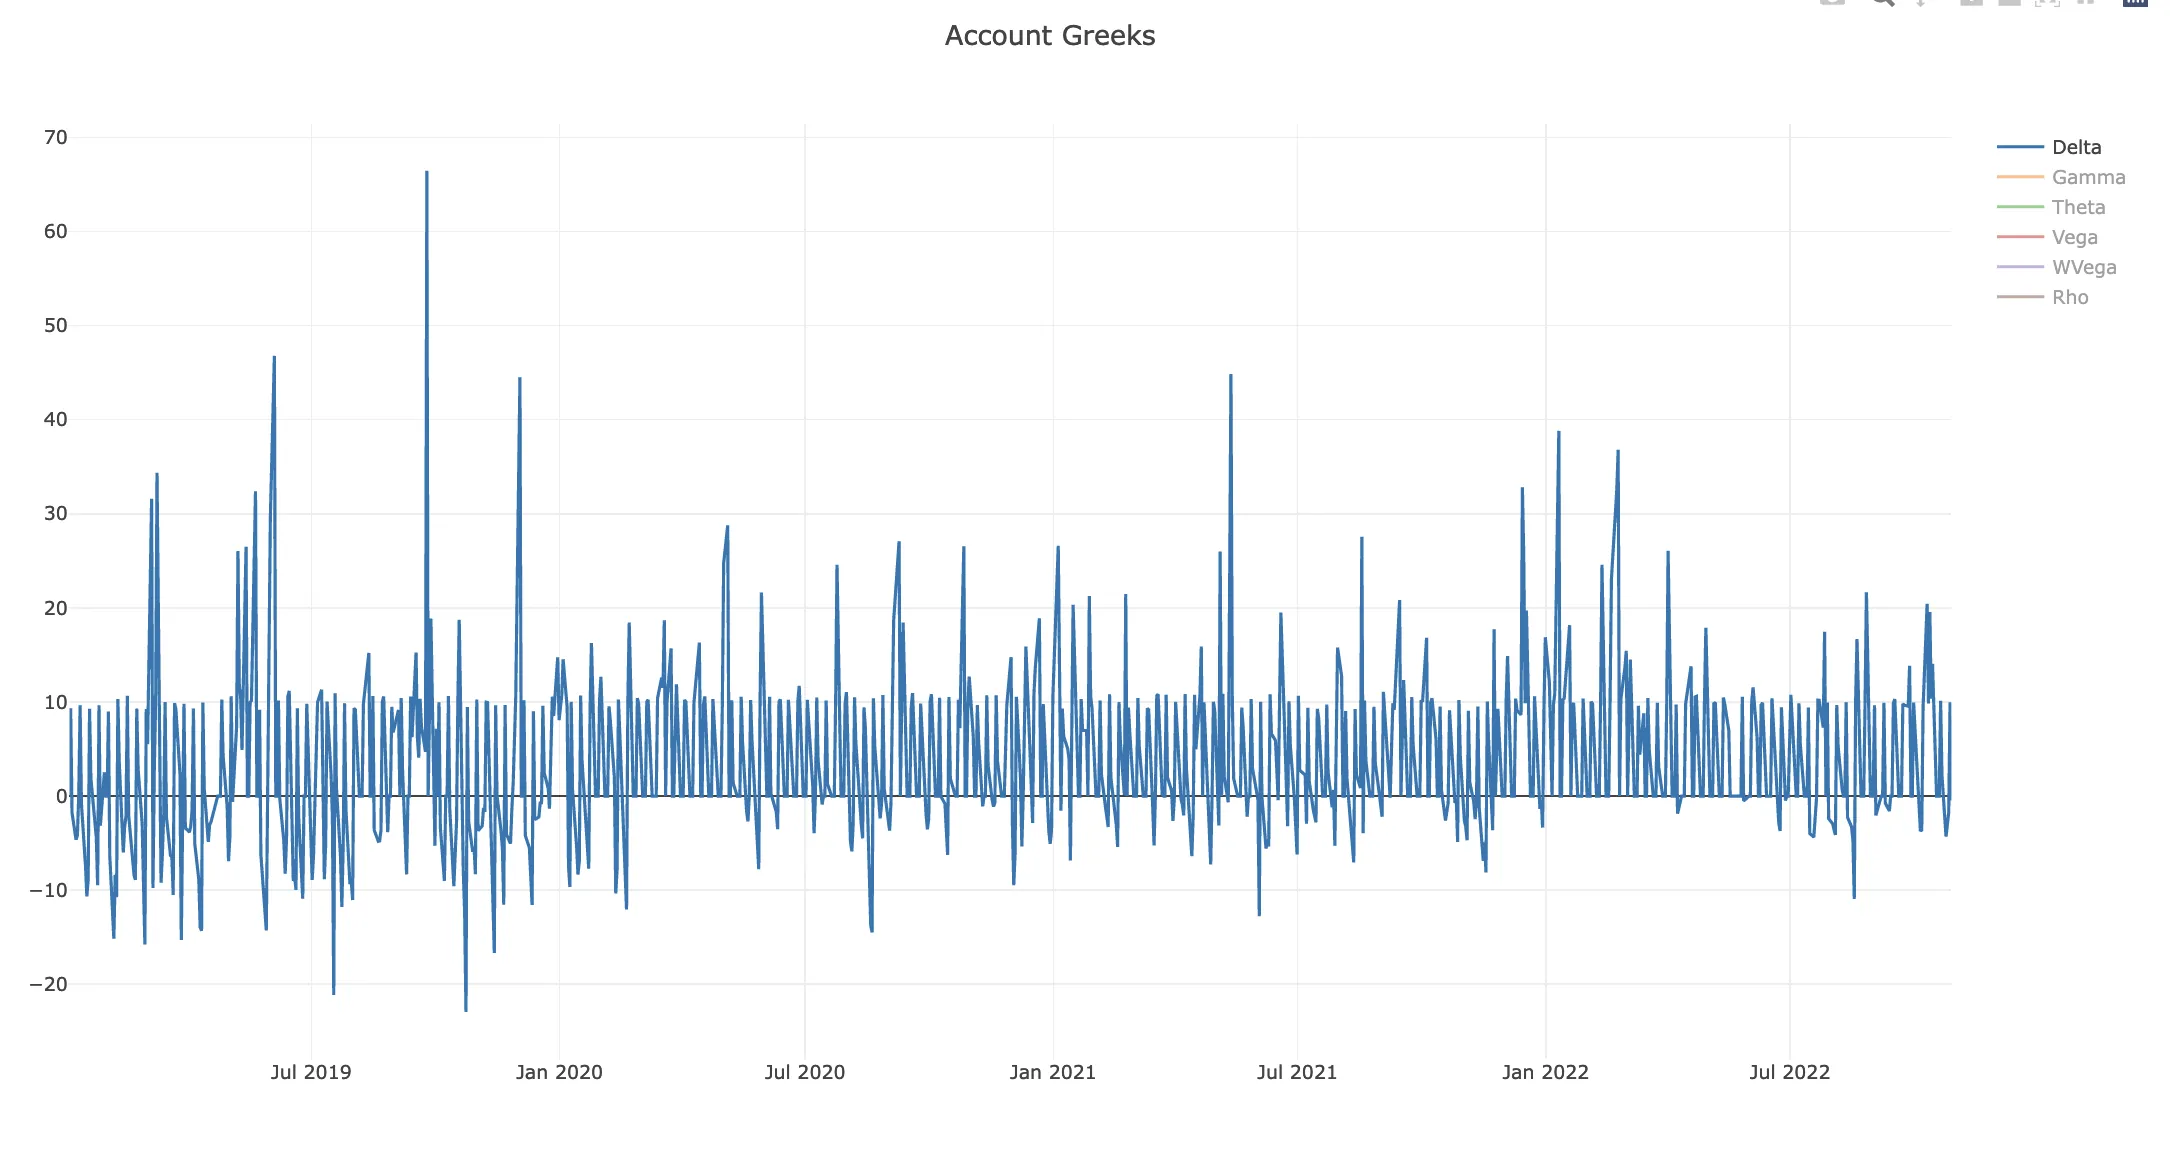
A delta-neutral strategy is beneficial as the underlying price moves will not affect the options trade.
Gamma
Gamma (the second-order greek describing the rate of change of Delta as a function of the underlying moves) shows that we are moderately exposed to price changes in the underlying. It would benefit us to keep Gamma under control and as close to 0 as possible.
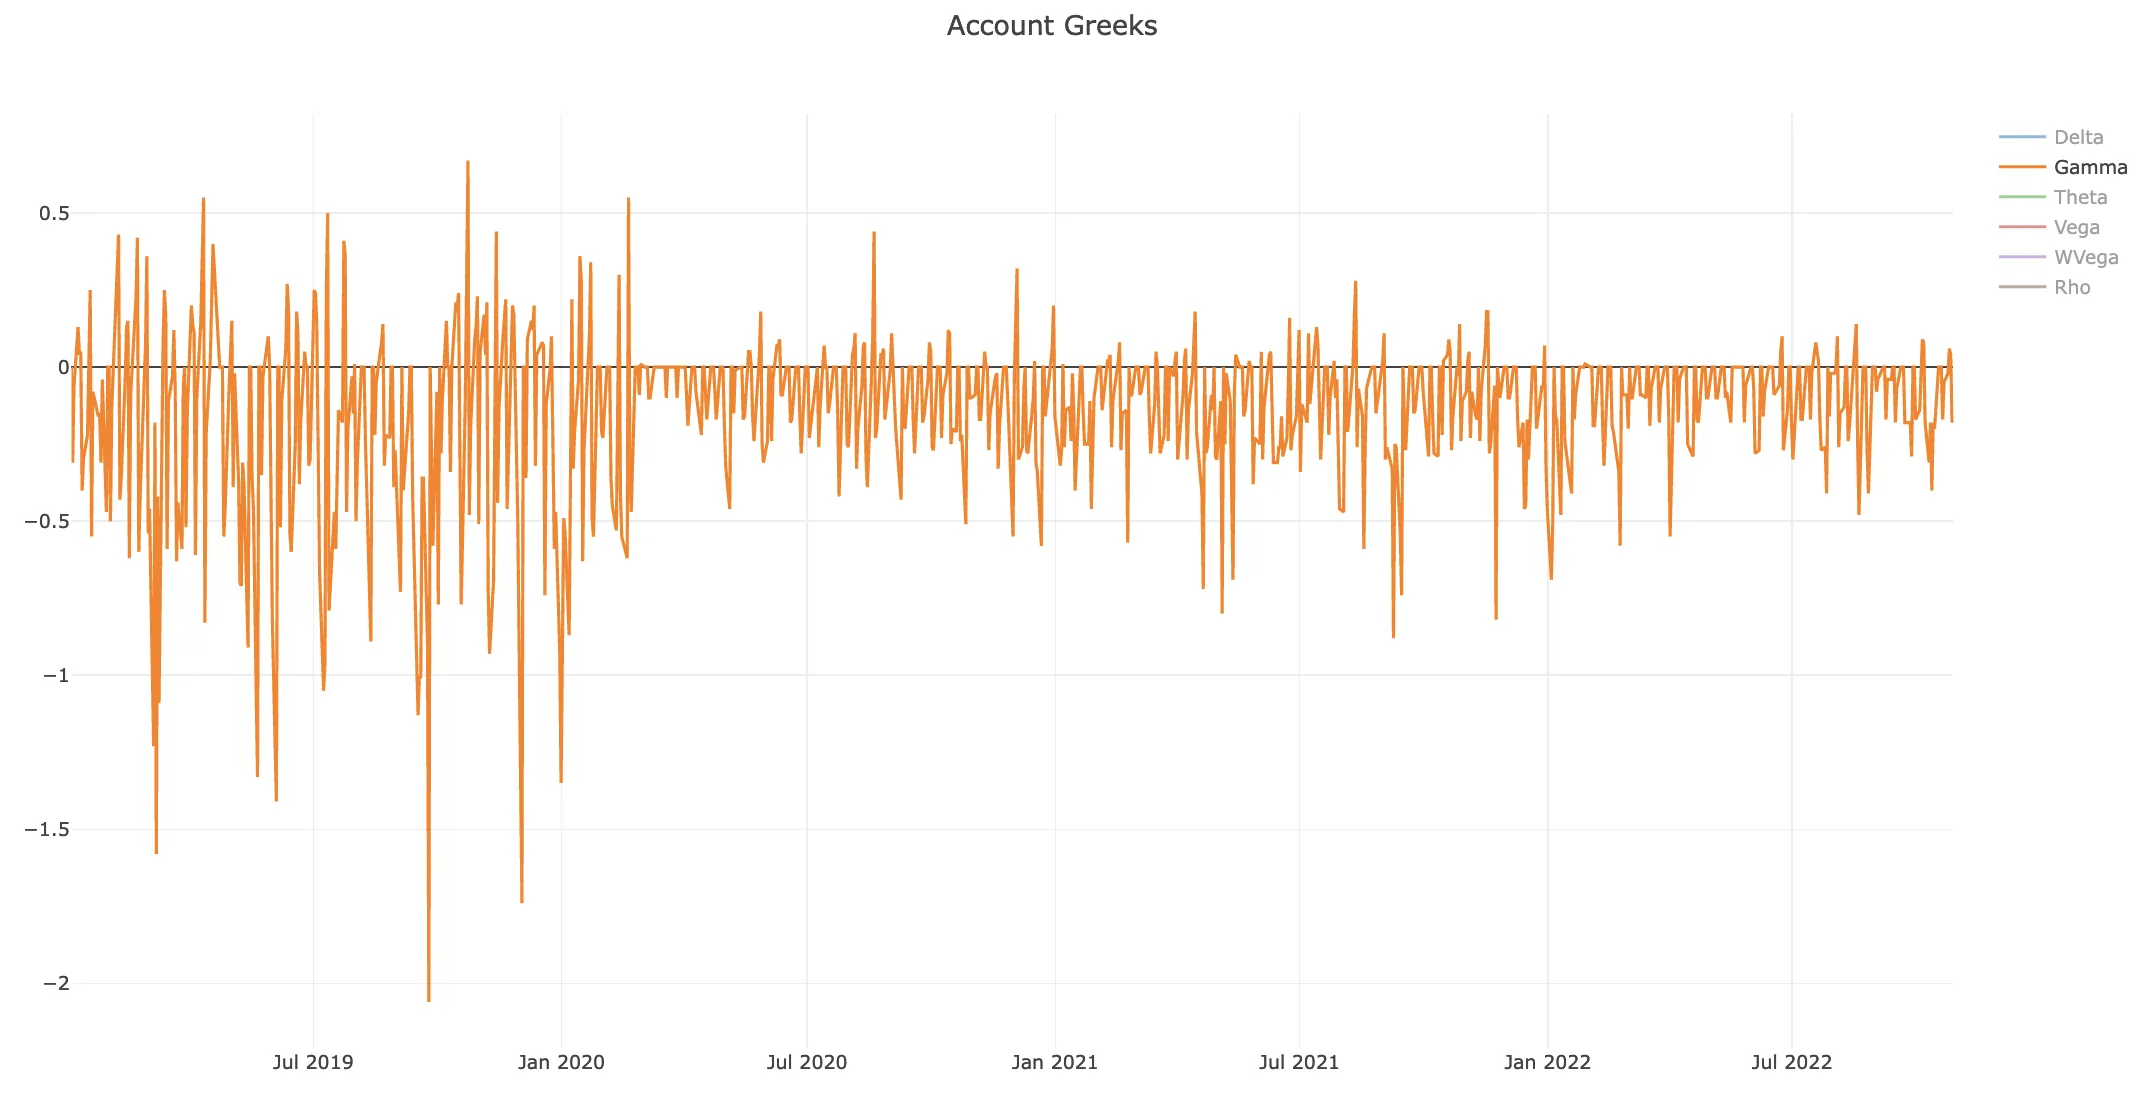
Having Gamma closer to zero would help our strategy to keep its delta close to the initiation range.
Theta
Theta describes the dollar amount we are receiving (or paying) on a daily basis to keep the structure open. Positive Theta means that we are getting paid by holding the position.
In the case of Boxcar, we see that the majority of the time, we have positive Theta, but there are times when Theta turns negative.
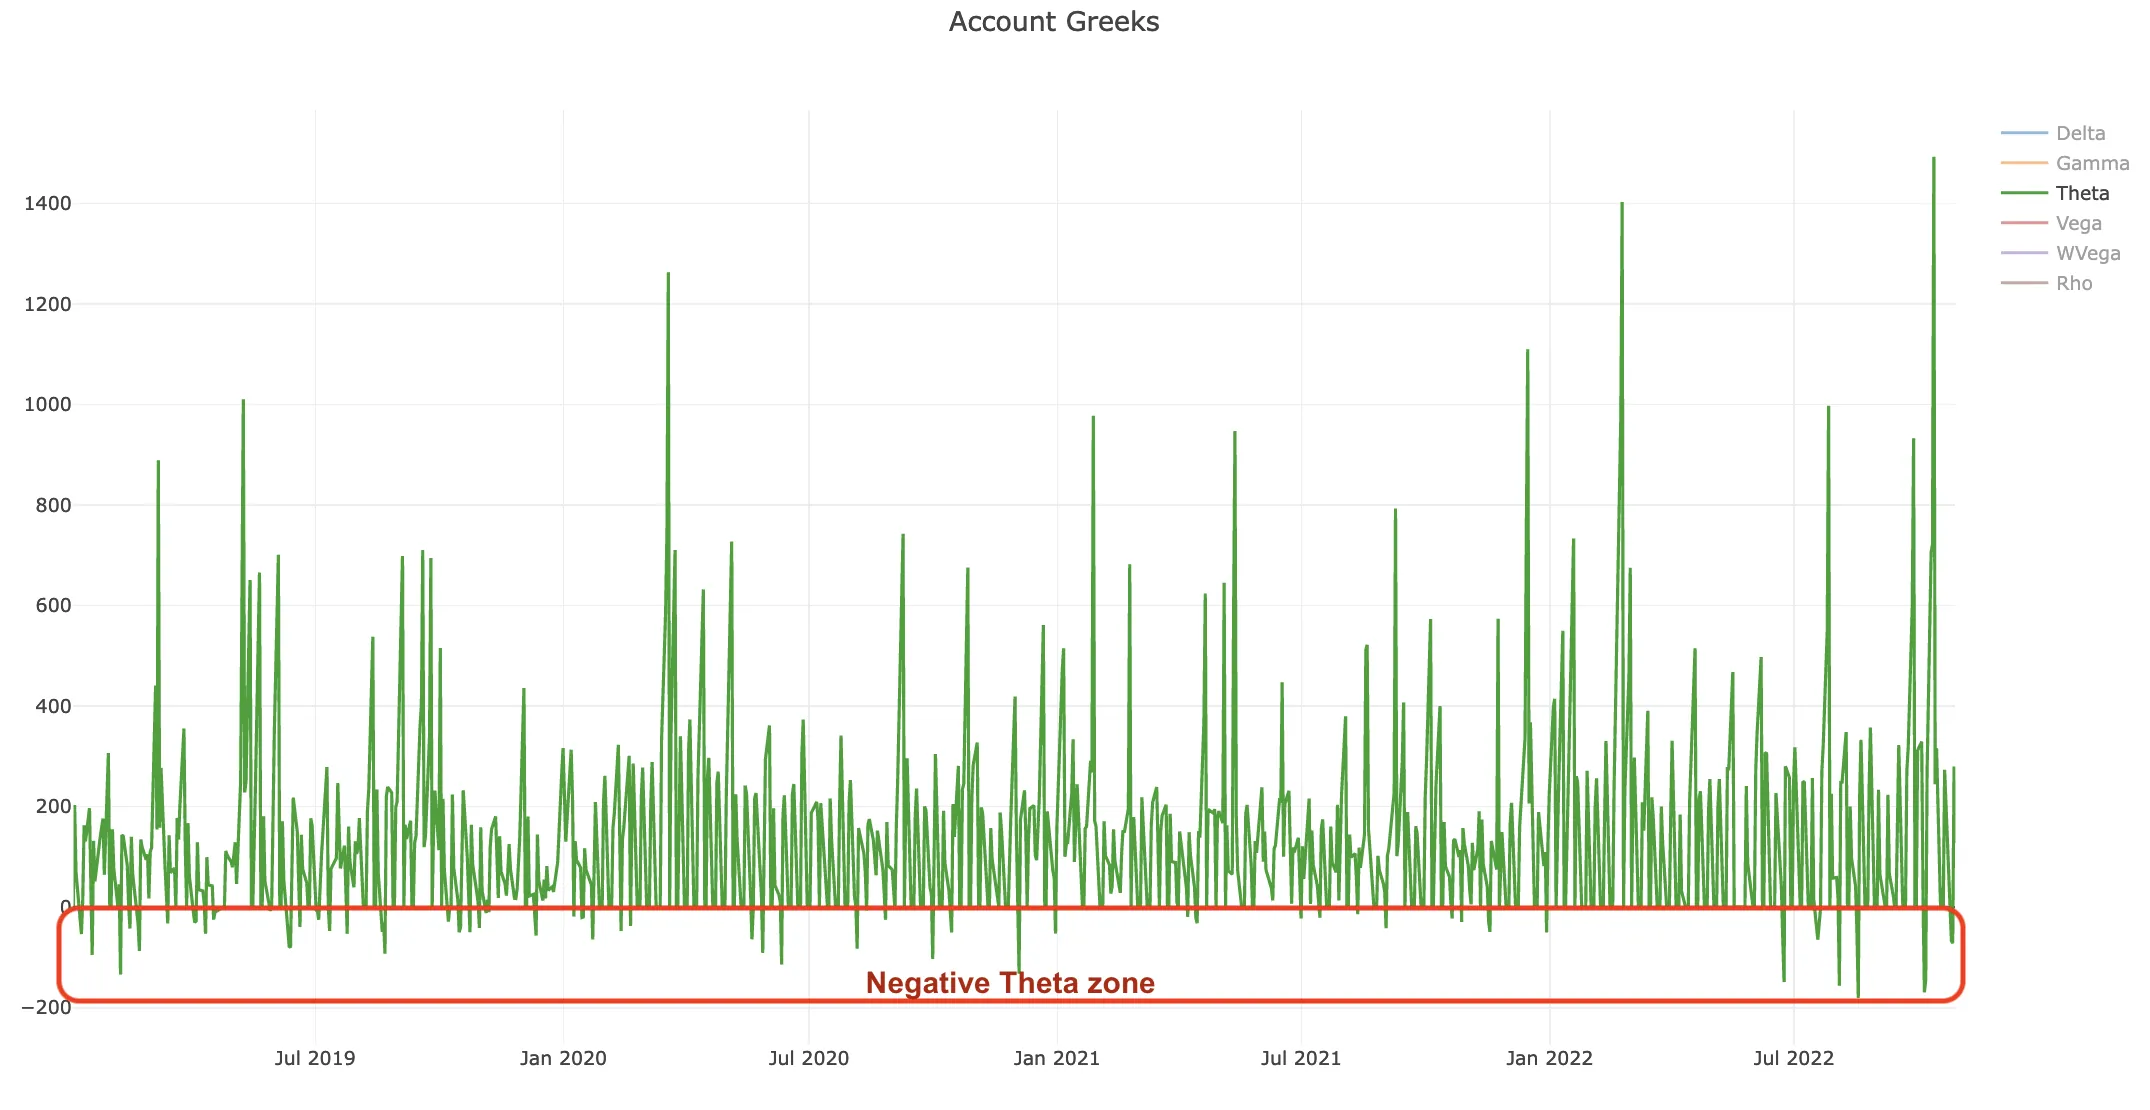
It is not beneficial to have negative Theta in an income trade. We should consider closing the trade as soon as it goes into negative Theta.
Vega
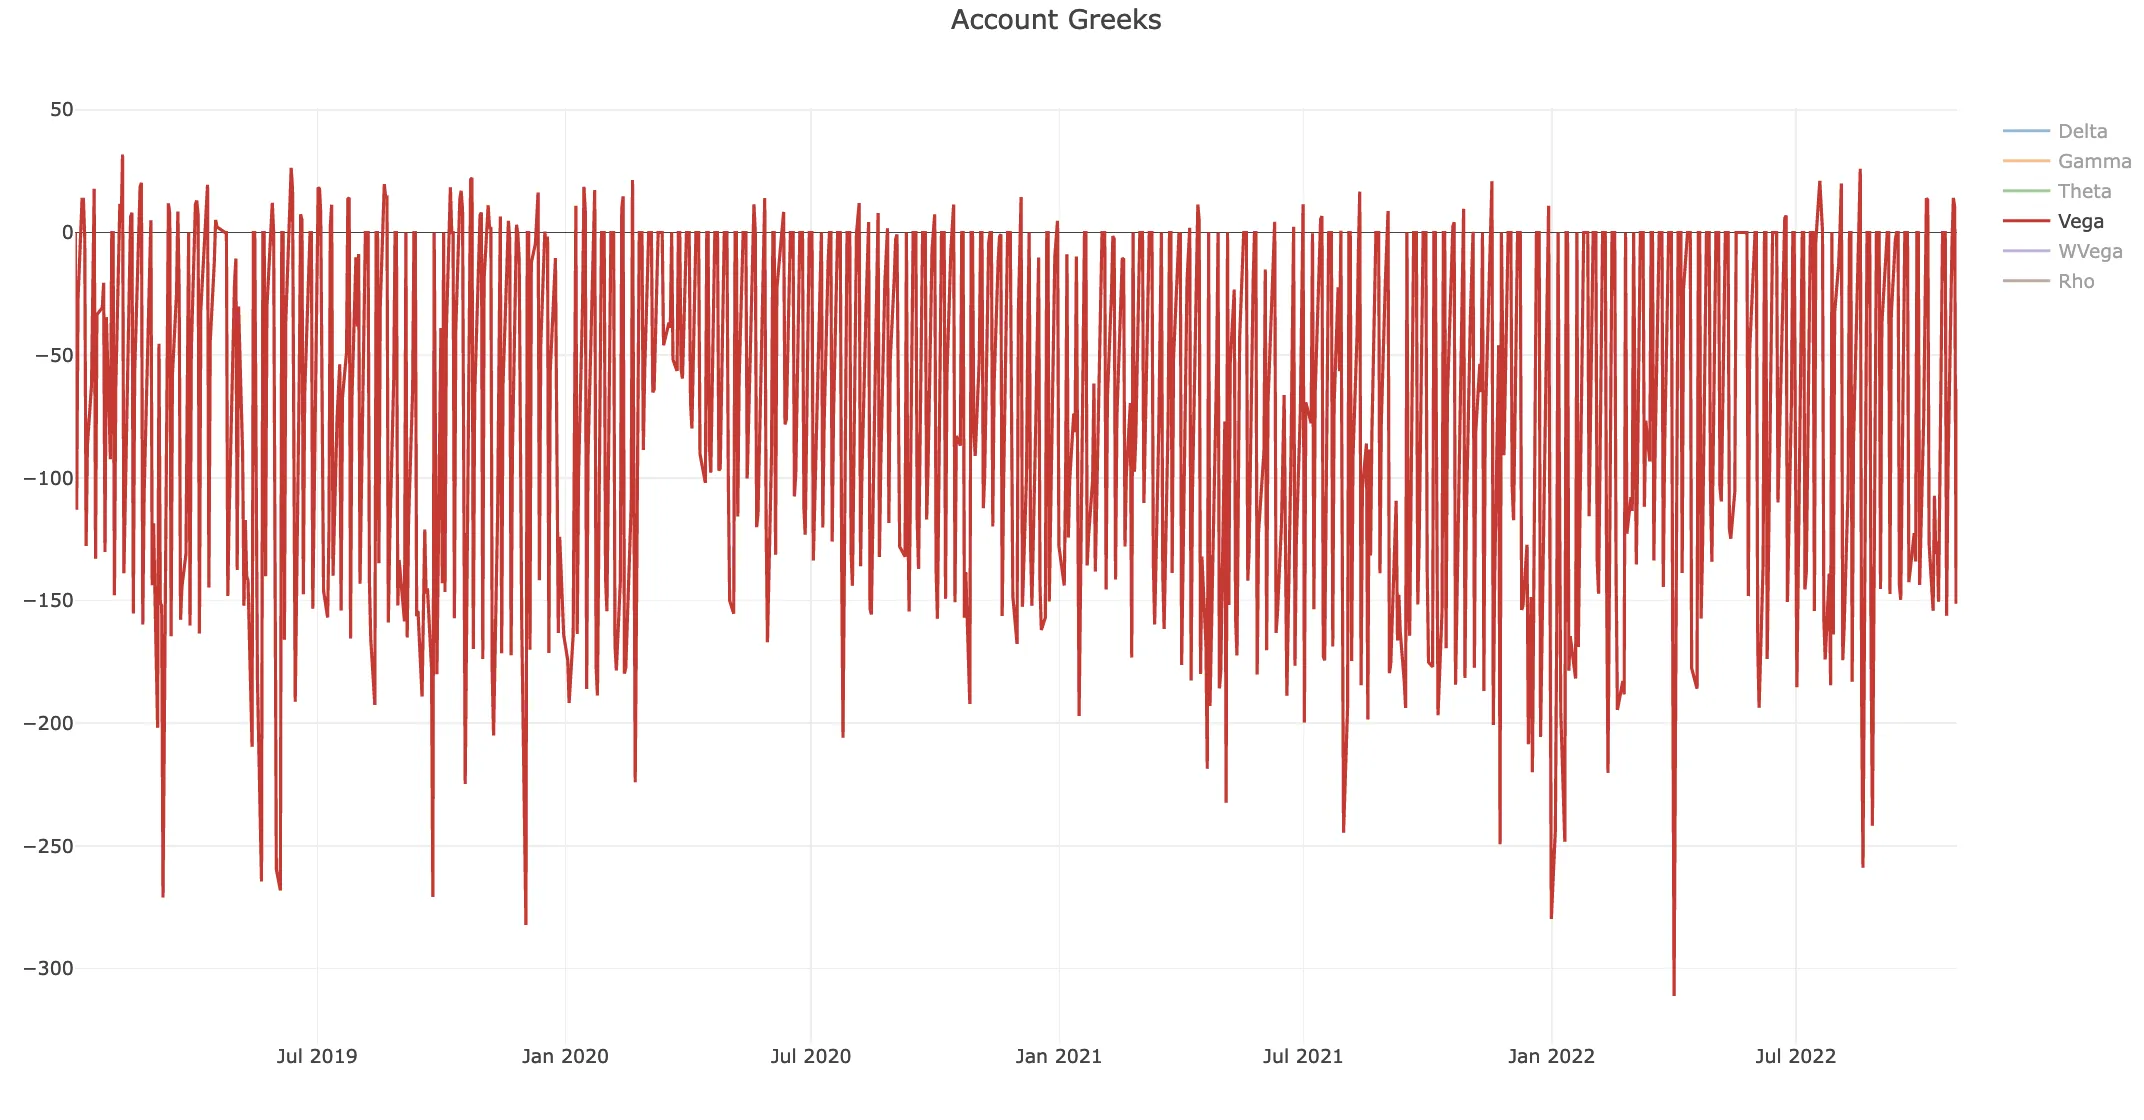
Vega represents how the option price changes as a function of the underlying volatility. Generally, income trades are negative vega (and positive theta), and that’s exactly what we see here.
Summary
We have taken Boxcar, an income trade that can be modeled in MesoSim using its powerful ScriptEngine. At the time of writing, other option-focused backtesters (from alpha to omega) are not flexible enough to model this trade.
We analyzed the trade using OptionNet Explorer, MesoSim’s Equity Graph, Portfolio metrics, and Greeks charts and identified optimization opportunities, which we will cover in the next episode of the series.
Due to the large drawdowns we do not recommend trading the Boxcar trade as described in this post.
In the follow-up post, we optimized the trade; please find the Boxcar-NG review here.
This article was originally written for MesoSim v2. The examples and terminology have been updated to match the MesoSim v3 Strategy Definition format. For details, see the MesoSim v3.0 release announcement and the v2→v3 migration guide. The performance metrics, described behavior, and referenced run results reflect the original v2 behavior. If you rerun the referenced strategies on MesoSim v3, results may differ slightly due to behavioral changes in the simulator.
