Alpha Research with MesoSim

Alpha is a quantifiable edge in systematic trading. A set of predictors that can be evaluated during entry and that have a statistically significant relationship to a position's terminal PnL can be considered alpha.
These predictors can be as simple as indicators on the underlying prices (e.g., RSI(14) on SPX), numerical representations of the term structure (e.g., IVTS: VIX/VIX3M), or alternative data harvested from satellites or the World Wide Web.
The Volatility Surface represents the market's expectations at different expirations and levels of moneyness. Therefore, Options offer a wide range of numerical data to analyze and identify potential edges. Since MesoSim exposes the simulation's event log to the user, alpha research stands as an achievable goal.
To expedite the research process, MesoSim integrates an interactive open-source analytics tool (called Voyager2), available under the Analytics tab of each backtest.
Using this tool, you can visualize all variables from your runs, including those defined via External Data. The video above explains the steps required to collect, de-noise (via binning), and visualize the potential predictors in your runs.
Here we provide additional directions and hints to enhance your probability of success.
Alpha for 0-DTE Iron Condor
The Alpha we shared in the video was discovered during the process of creating education material (the video) at February of 2025.
We used the 2020. 01. 01. - 2024. 12. 31. period as In-Sample optimization period and retained 2025 for validation. You can find
the results here:
Ideally one should retain longer OOS period for validation. Our choice of shorter OOS was motivated by the goal of having a recent educational example.
The Alpha described with MesoSim's Entry filter via AbortConditions:
  "Entry": {
    ...
    "AbortConditions": [
      "pos_vega / (pos_gamma * pos_margin) < 0.010"
    ]
  },
  ...
Strategy description
The strategy is based on Tammy Chambless’s 0-DTE strategy.
Unfortunately, the video describing this strategy is not available anymore, but we’ll summarize it briefly here:
Every Monday, Wednesday, Friday we open a 0 DTE Iron Condor structure 30 minutes after the open. Shorts are at 5 delta, the longs are 25 points away. Stop Loss is set to 3x the credit received on the put side.
Importance of Features
The information content of the data matters. Applying various transformations (such as adding indicators to the underlying), does not necessarily increase the information content. Introducing new information through related data is an option. Such related data can be any data linked to the underlying in question — e.g., VIX at various expirations for SPX, RVX in the case of RUT, or sector-based indices that provide further breakdown. This additional data can be brought in using the External Data facility of MesoSim.
Prediction length and type
It is intuitive that predicting the outcome of a position held for a few days is easier than forecasting that of positions held for longer periods. Therefore, trading strategies with shorter holding periods are better targets for such optimizations.
In addition to duration, the type of option trading strategy also matters: Options can be used for both directional and non-directional (delta-neutral) trades. Evidence suggests that it is easier to predict volatility (as it clusters and mean-reverts) than returns. Therefore, strategies that are more reliant on volatility are easier targets for alpha research than those that take directional bets.
Public Sources
As markets become increasingly efficient, it becomes more difficult to discover alphas. Once published, their predictive power frequently fades. Therefore, it is not in the researchers' best interest to publish these signals. Nonetheless, some researchers do publish their findings. We found the following resources useful for identifying potential edges:
- Chrilly Donninger's publications. IVTS remains largely useful.
- Zura Kakushadze's 101 formulaic alphas.
- Stefan Jansen's Machine Learning for Algorithmic Trading book and its respective Notebooks showcases alphas
- Perry J. Kaufman's Trading Systems and Methods book contains numerous systems that might spark ideas
- Publication plaforms: arxiv, ssrn, jstor
Avoiding Overfitting
One of the potential dangers of large-scale data analysis is the risk of overfitting. Overfitting occurs when noise is mistakenly identified as valid predictors.
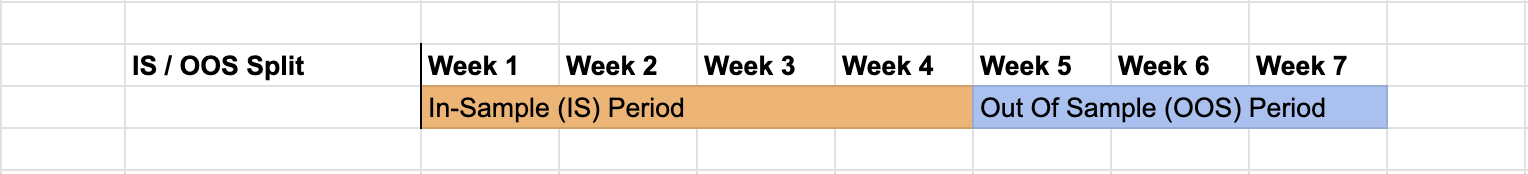
IS / OOS split
The risk of overfitting can be reduced by splitting the data into In-Sample (where optimization occurs) and Out-Of-Sample (where final validation takes place) segments, ensuring that performance across these timeframes does not differ significantly.
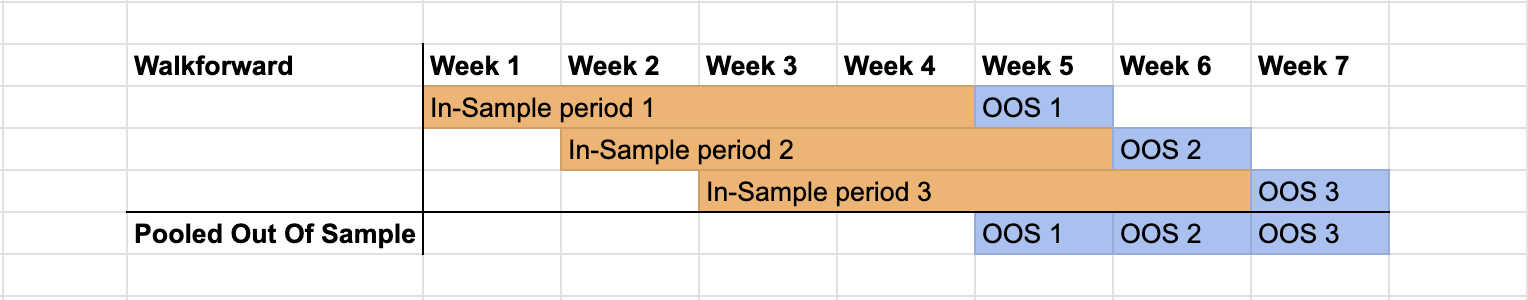
Walkforward Analysis
A more thorough approach is Walkforward Analysis, as described in Robert Pardo's The Evaluation and Optimization of Trading Strategies book:
- Specify an in-sample training period spanning multiple days or weeks of data.
- Analyze the in-sample period to identify predictors.
- Apply the identified predictors to a small out-of-sample period (e.g., one day or week) immediately following the in-sample period.
- Shift the training period forward by the length of the out-of-sample period and repeat the process.
- Finally, pool all the Out of Sample results and evaluate trade performance
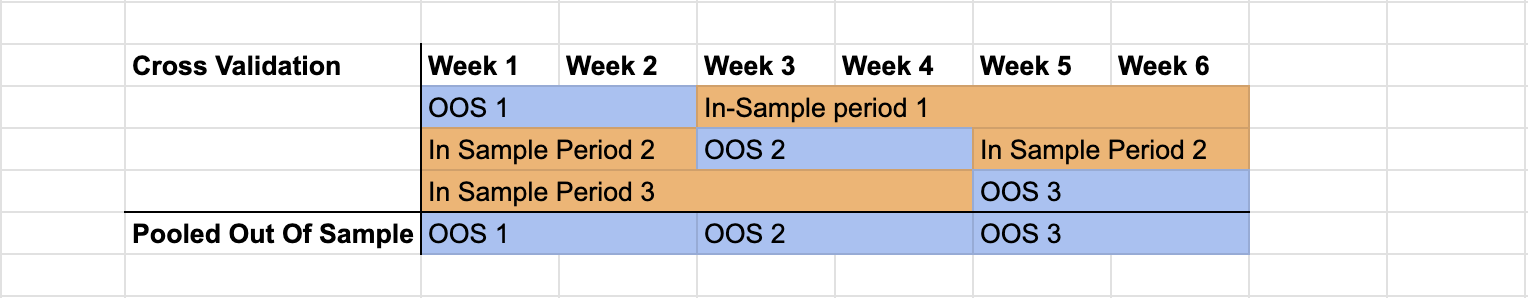
Cross Validation
Cross Validation is an alternative to Walkforward Analysis, where the entire period is pooled, but the order of In-Sample and Out-of-Sample data is not enforced. The weakness of this approach is that it does not reflect how real-life trading strategies are trained and executed. For the sake of completeness, we include the process here.
While an In-Sample/Out-Of-Sample split-based analysis can be conducted manually, but Walkforward and Cross Validation approaches requires automation. This automation can be achieved by post-processing MesoSim's exported event log.
In the era of large language models like ChatGPT and Claude, even individuals who do not code full-time can tackle small programming tasks. Walk-forward analysis and the use of Alphalens on MesoSim event data can be accomplished simply by instructing these models.
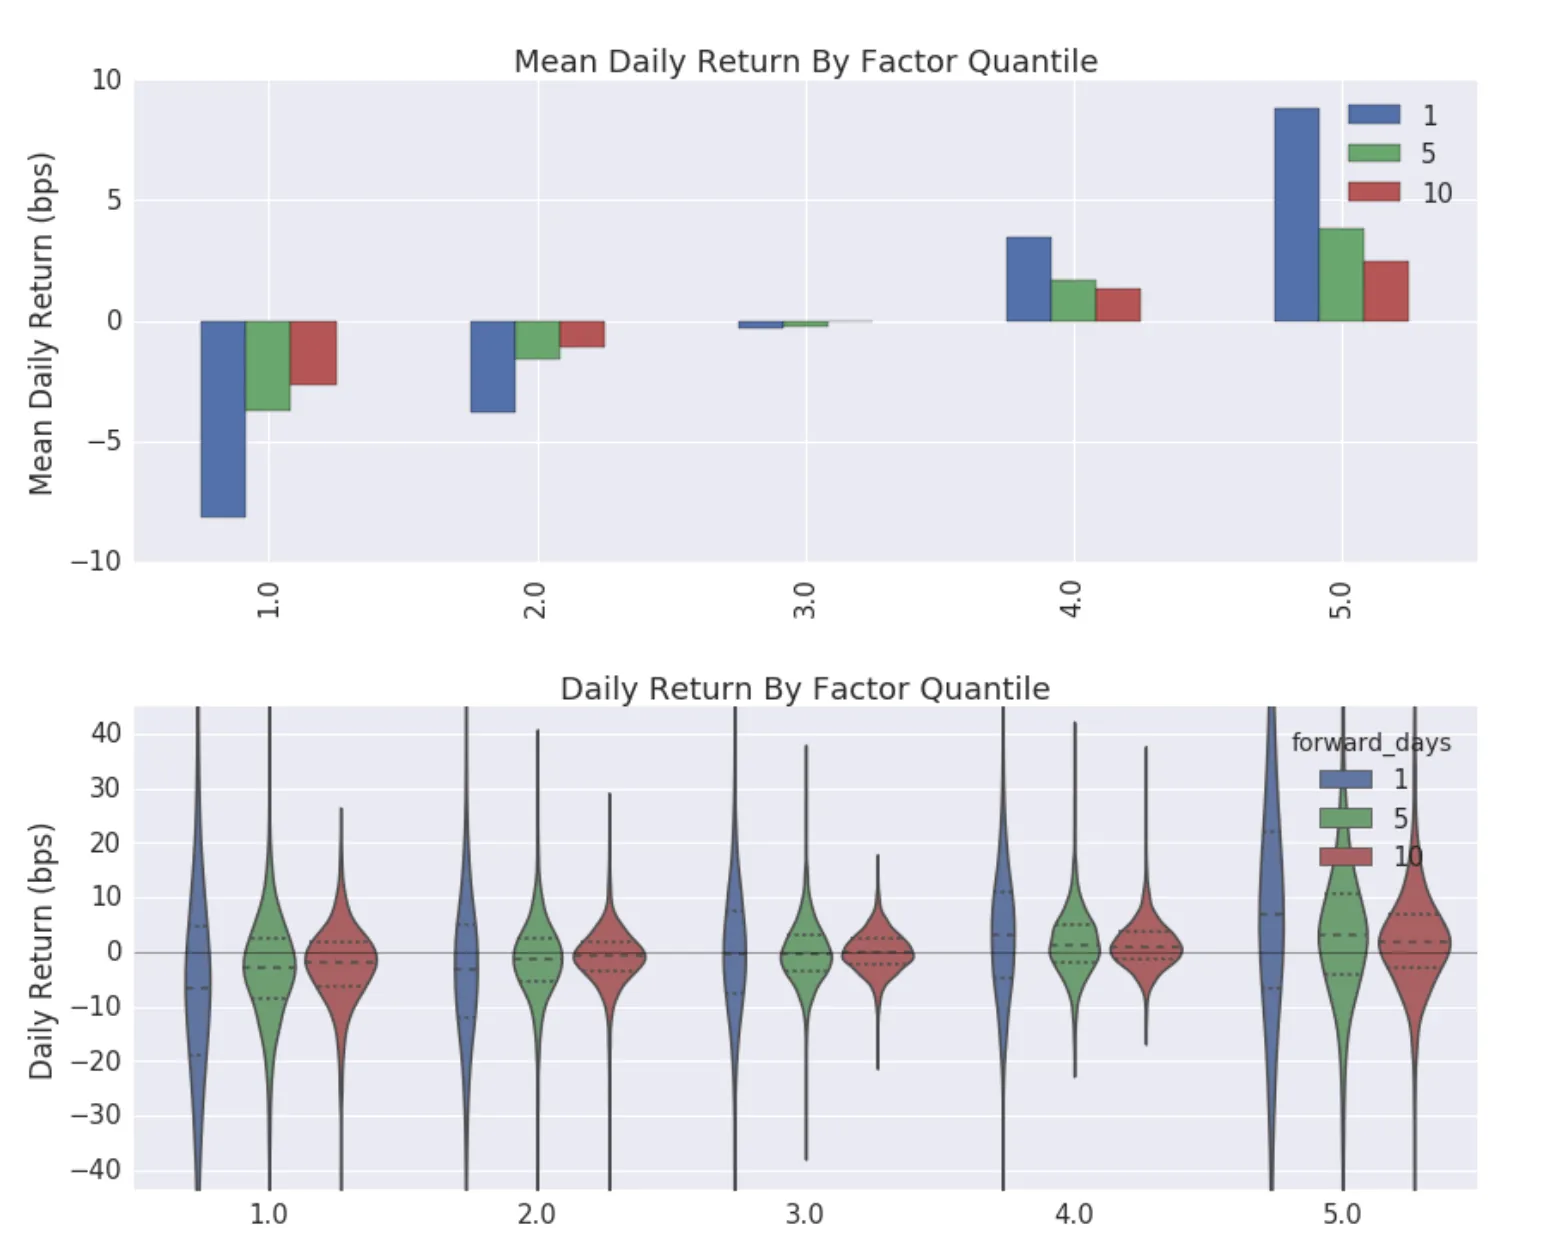
Digging deeper with AlphaLens
Alphalens by Quantopian streamlines the Alpha Research process by generating tearsheet-like graphs that visualize Information Coefficients, Binned Forward Returns, and Sector based breakdowns.
Since Quantopian went out of business, the library is no longer under active development, but forks, such as Stefan Jansen's Alphalens-Reloaded are readily available.
With some data transformation on MesoSim's Event Log (extracting ExitPosition events and the respective NAV series), Alphalens can be used to study options trading strategies.
Deltaray FundPro
Our most comprehensive offering, Deltaray FundPro, not only provides API access to all our products but also delivers a fully automated solution for Alpha Discovery using advanced machine learning models tuned for trading. Its deep integration with MesoSim and MesoLive makes it possible to regularly optimize and trade portfolios of options trading strategies. Moreover, our code samples on Grid Search and Genetic Algorithms demonstrate best practices in Trade Discovery area as well.
If you would like to learn more about this offering, please reach out to [email protected].
This article was originally written for MesoSim v2. The examples and terminology have been updated to match the MesoSim v3 Strategy Definition format. For details, see the MesoSim v3.0 release announcement and the v2→v3 migration guide. The performance metrics, described behavior, and referenced run results reflect the original v2 behavior. If you rerun the referenced strategies on MesoSim v3, results may differ slightly due to behavioral changes in the simulator.