Boxcar-NG: An optimized Boxcar Trade

Introduction
In the previous post, we analyzed the Boxcar trade’s entry and identified a set of optimization opportunities. In this episode, we will investigate the opportunities outlined: We will use IV Rank, the underlying price’s relations to previous day and the position Greeks at initiation and throughout the trade.
Overfitting: The Danger of Optimization
The critical challenge of trading system development is to avoid optimizing on random noise, which is called overfitting. By including too many optimizable parameters we will find a set of parameters that provides excellent in-sample performance but it will fail on unseen data as noise does not repeat by definition.
Our way of tackling overfitting is to set away Out of Sample data to validate our final model. We will be using the 2017 - 2018 timeframe only once, to validate our best model.
Baseline for optimization
A baseline for optimization should contain the structure and its basic trade rules (such as entry time, exit time and max days in trade). The baseline, however, should not contain any Profit Target and Stop Loss or any optimizable parameter so we can study the trade in its purest form.
The Optimization Baseline for Boxcar looks as follows: https://mesosim.io/backtests/f3cf64be-62af-4005-b43e-f2618b62d97f

During the optimization process, we will be tracking the following metrics and comparing them to the baseline:
- Trade Count
- Alpha
- Beta
- Sharpe
- CAGR %
- Max Drawdown %
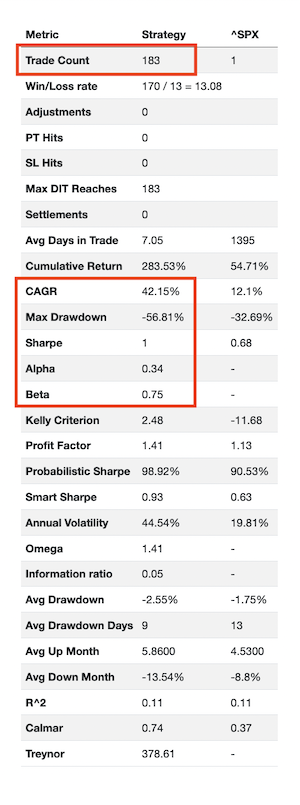
Optimization
Approach
Optimization starts by identifying the parameters that might profoundly affect the strategy performance. In the previous article, we identified that market states and greeks are good targets for optimization.
To reduce the chances of overfitting, we are not brute-forcing (i.e., not trying out all combinations) the parameter set. Instead, we are studying how the various parameters are affecting strategy performance by creating experiments where we try multiple values for the respective parameter.
Our parameters for the experiments of the Boxcar trade are:
- IV Rank
- Price relation to the previous day’s price (filter for up or down days)
- Delta
- Theta
Then we define a valid set of values for each parameter and execute the backtest by combining the baseline with each value of the given parameter. For example, for IV Rank, enter when:
- IV Rank < 90
- IV Rank < 80
- IV Rank < 70
- …
- Initial Delta = 0
- Initial Delta = 10
- Initial Delta = 20
- …
Once we obtain all the performance metrics for each run, we analyze which parameter helps to achieve better performance. If we find that specific parameters are helping our strategy to perform better, we blend them and validate that the combined parameter set works better together than any of the individual parameters alone.
IV Rank Filter
IV Rank (Implied Volatility Rank, sometimes also referred to as IVR) is an options trading metric that identifies the implied volatility compared to the IV history of the last 365 days. It’s measured on a scale of 0 to 100, where options with a higher IV Rank are more expensive.
In MesoSim, we use IV Rank as an Entry Filter (via the Entry.Conditions field). IV Rank in our experiment is scaled from 10 to 90 with a step of 10. For more specific information, please see our documentation's Strategy Definition Reference section. IV Rank in MesoSim is listed in the underlying variables section.
We have collected all the runs in the following table:

Notice the following:
- The trade count is decreasing as we filter out more and more trades based on the IV Rank
- Alpha steadily increases until we reach IVRank=60
- Beta continuously decreases throughout the scaling exercise
- Sharpe increases until IVRank=50, then starts to decline.
- An outlier Sharpe is present at IVRank=30
Alpha - Alpha is a measure for reporting how much an investment returned compared to an index or other benchmark. The higher the better.
Beta - Beta shows how volatile a security’s performance is compared to the market as a whole. The closer to 0 the better.
Sharpe - The Sharpe ratio compares the return of an investment to its risk. The higher the better, above 1.5 it is considered good.
It is tempting to pick a run where Sharpe is maximized (IVRank=30), but we must proceed with caution: The number of trades is significantly reduced (by 30%), and the run’s Alpha (0.29) is smaller than our baseline run.
We pick the run where IVRank=60, which maximizes our alpha and has a positive impact on Sharpe.
Comparing the IVRank=60 run with our baseline run, we confirm that the IV Rank filter mitigates both COVID Crash and the 2022 Sideways market.

Up and Down Day Filter
Sometimes people suggest that a particular strategy works better when opened on “up days” (where the opening price is higher than the previous day’s closing price) or on “down days” (where the opening price is less than the previous day’s closing price).
Our experience with Theta harvesting income strategies is that it is not really relevant. Nevertheless, it is easy to validate by creating an Entry Filter (via Entry.Conditions) field to enter only when we observe the following:
Down Day:
underlying_today_open < underlying_prevday_close
Very Down Day:
underlying_today_open < underlying_prevday_close and underlying_price < underlying_today_open
Up Day:
underlying_today_open > underlying_prevday_close
Very Up Day:
underlying_today_open > underlying_prevday_close and underlying_price > underlying_today_open
The collected results in the table below show that these filters didn't improve the strategy’s performance. We did notice that the “Down Days” and “Very Down Days” scenarios worsened the performance. Therefore we included a filter that only enters when those conditions are not true: NotDownDay, NotVeryDownDay.
Unfortunately, neither of these test scenarios provides any meaningful improvement on the strategy; therefore, we will not use these filters in the combined run.

Delta at Initiation
Delta plays a vital role in strategy development.Simply put, it describes the directionality of the trade.
A delta of 100 for a 1-lot trade follows exactly the underlying, while a delta of -100 moves in the opposite direction. With income trades, delta neutrality (delta=0) is often targeted; however, with the Boxcar trade, the author specifies delta=10 as the initial target for the 10-lot trade.
Given that too much directionality exposes the trade to the underlying movement, we suspect this isn’t ideal. To avoid too much directionality, we create an Exit Condition that closes the trade once Delta reaches 15, 20, 25, … 100 for the 10 lot position (MaxDelta-15, … MaxDelta-100). Running these experiments, we do not observe any reasonable improvement in the overall trade.
Modifying the trade such that the position that it becomes delta neutral at initiation (DeltaNeutral-Start: delta=0 at initiation) shows significant improvement both for Alpha and Beta statistical measures. We will use this modification in the combined run along with the previously selected IV Rank filter.

Theta Filter
We observed in the original trade that Theta could become negative, which is counterproductive for an income trade where we are getting paid (as Theta is positive) by Selling Options. We suspect that positive theta at initiation (ThetaFilter-Positive) has a positive effect on the trade. It might also be helpful to exit trades early when the position theta becomes too low (ThetaFilter-Decay-*) compared to the position theta at the initiation.
The Theta Positivity Check at initiation is done via Entry.AbortCondition which is evaluated immediately after the legs for the position is selected but before the trade is entered. Using this construct, we can abort trade entries if the conditions aren’t ideal (such as position theta being negative).
For the Theta Decay Filter, we are recording the Position Theta at initiation to the initial_theta variable and setting an Exit.Condition statement which validates that the current position theta is still greater than 50%, 33%, or 25% of the initial_theta value.

After execution, we conclude that Positive Theta at initiation helps somewhat the Risk-Adjusted Return (Sharpe), but it degrades both Alpha and Beta. Similarly, the Theta Decay filters are proven ineffective - likely since we are exiting trades early and not entering before the following Thursday or Friday.
Due to the lack of improved performance, we will not consider Theta-based filters in our combined runs.
Combined Run
We went through a series of optimization attempts and identified IVRank=60 and DeltaNeutralStart cases which had a positive impact on the strategy performance. We expect that if we combine the two, we will see further improvements as the two optimizations target different weaknesses of the strategy.
The combined run of the two parameters can be found here: https://mesosim.io/backtests/8cf8b3ea-5f02-4c2d-8e85-440ccdd07b4c
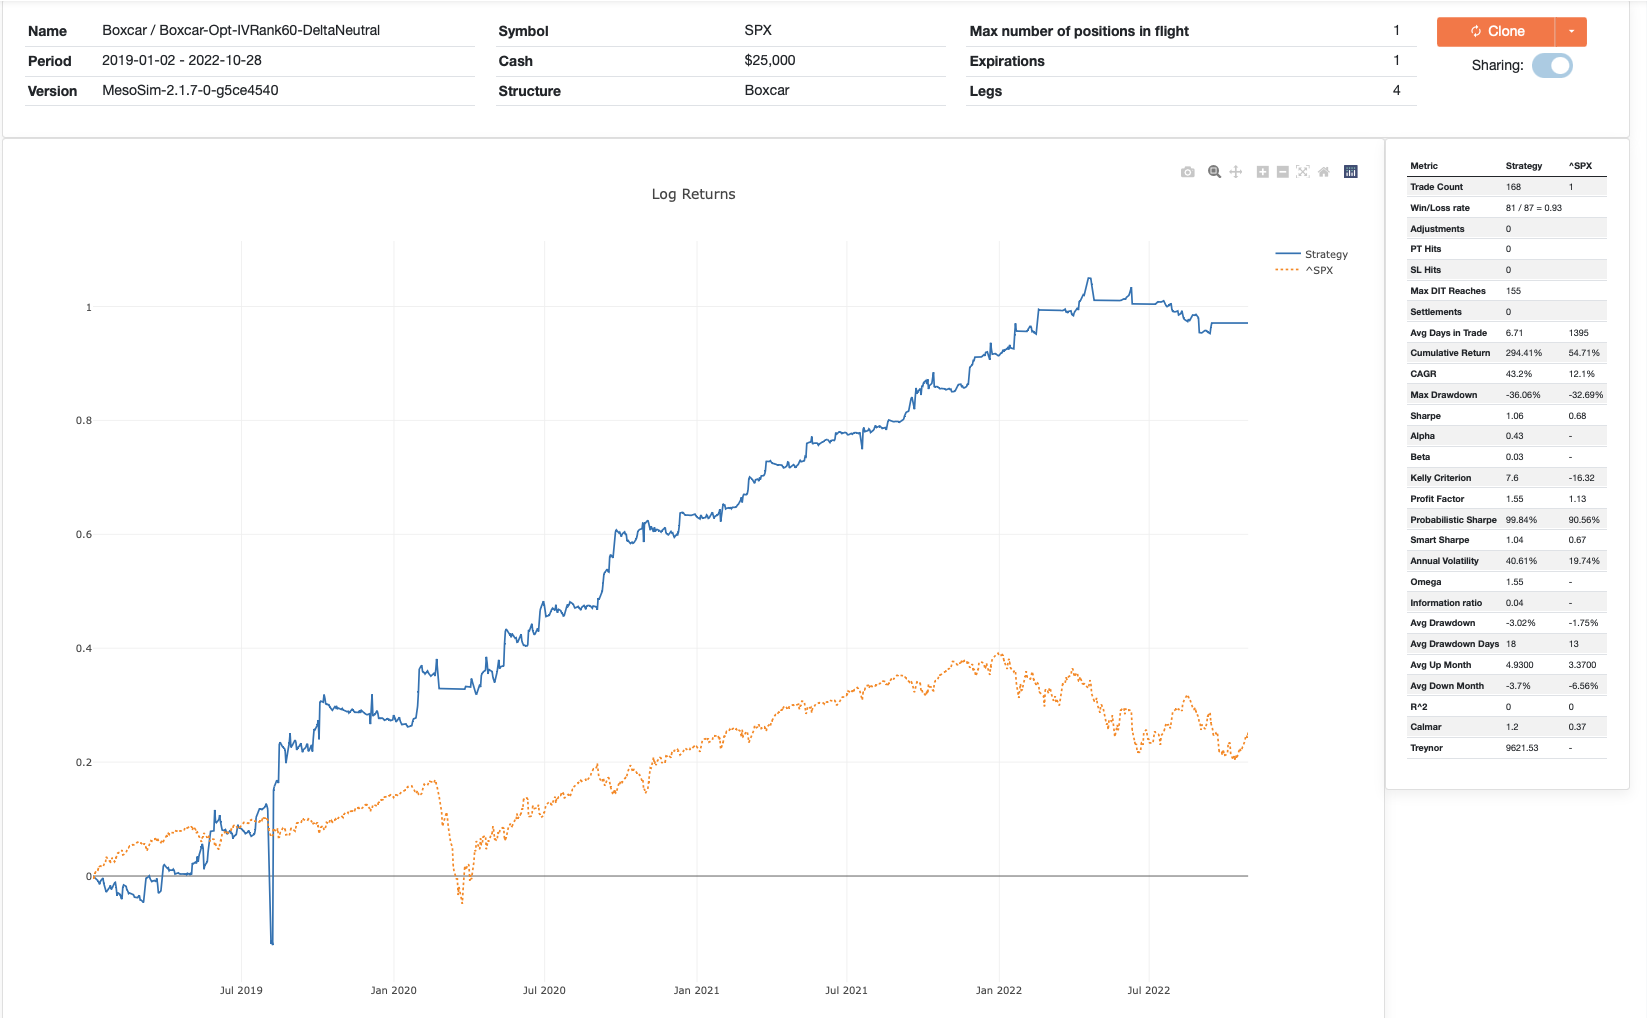
The run confirms that the performance is indeed better than the original setup, the IVRank=60 filter, and the Delta Neutral setup.
Both the strategy’s Alpha and Beta improved, while the Sharpe ratio (our risk-adjusted return metric) substantially improved. However, we note that the Max Drawdown is still too much: 25%. To recover from a 25% loss, we need to gain over 30%.
To address the Max Drawdown, we still have one final parameter to optimize: The Stop Loss of the strategy. MesoSim’s Intra-trade drawdown chart helps to set a reasonable price target for StopLoss:

The graph displays each trade's maximum (unrealized) profit, maximum (unrealized) loss, and realized loss. From the graph, we notice that around $2k loss would be considered normal or acceptable for the majority of 2020 and 2021. A fixed dollar amount (such as $2000) works for some time, but it will be skewed as the underlying changes over time. Therefore, we are instead defining the StopLoss based on the Underlying Price:
For 2019, ^SPX was trading at around $2500 - $3000. If we take 70% of the underlying, we will end up at around the $2k mark, which looks like a reasonable target for Stop Loss. Alternatively, we could consider the overall structure’s price as a basis for our calculation.
Adding underlying_price * 0.7 as Exit.StopLoss results in the following run: https://mesosim.io/backtests/21ae1a3d-c146-40d2-bed4-fb8d1c13c026
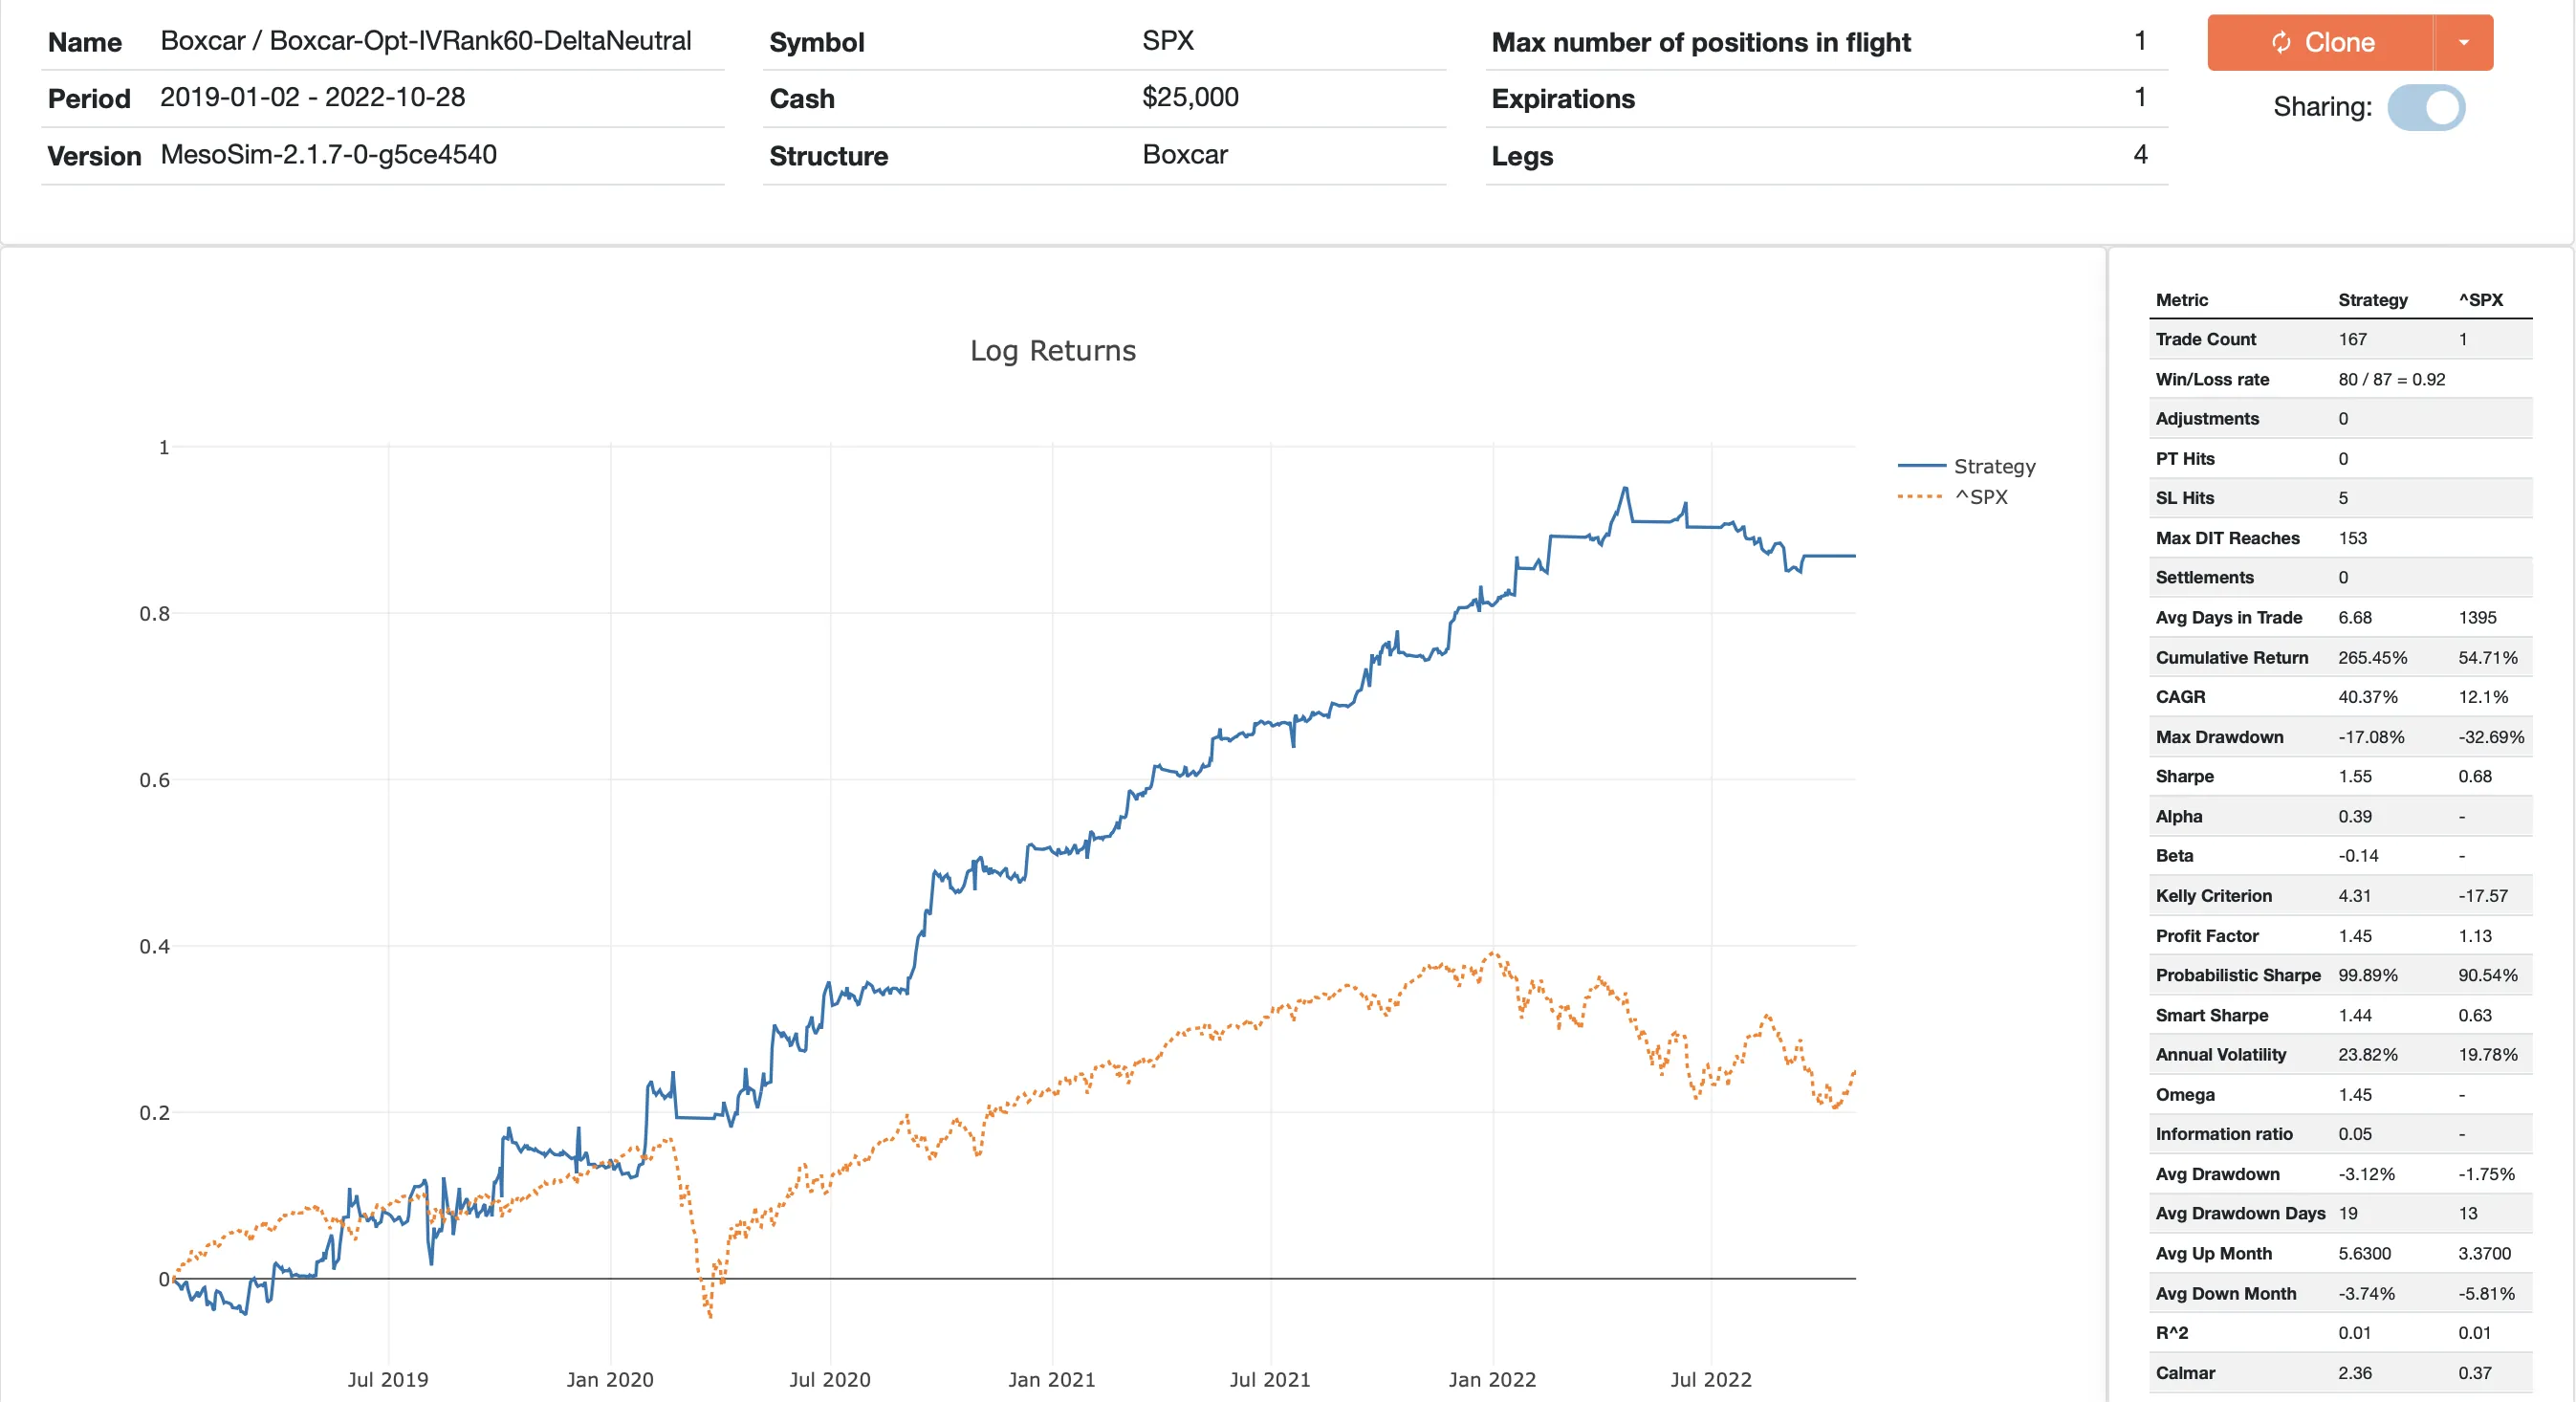
Looking at the metrics, we can confirm that the trade’s metric is now in the respectable range both in terms of Alpha, CAGR, Max Drawdown, and Sharpe.

Validation
As a final step, we need to validate our optimization using Out of Sample (OOS) data. To quote Timothy Masters: “Out Of Sample data is precious. Use it once. Or very few times”.
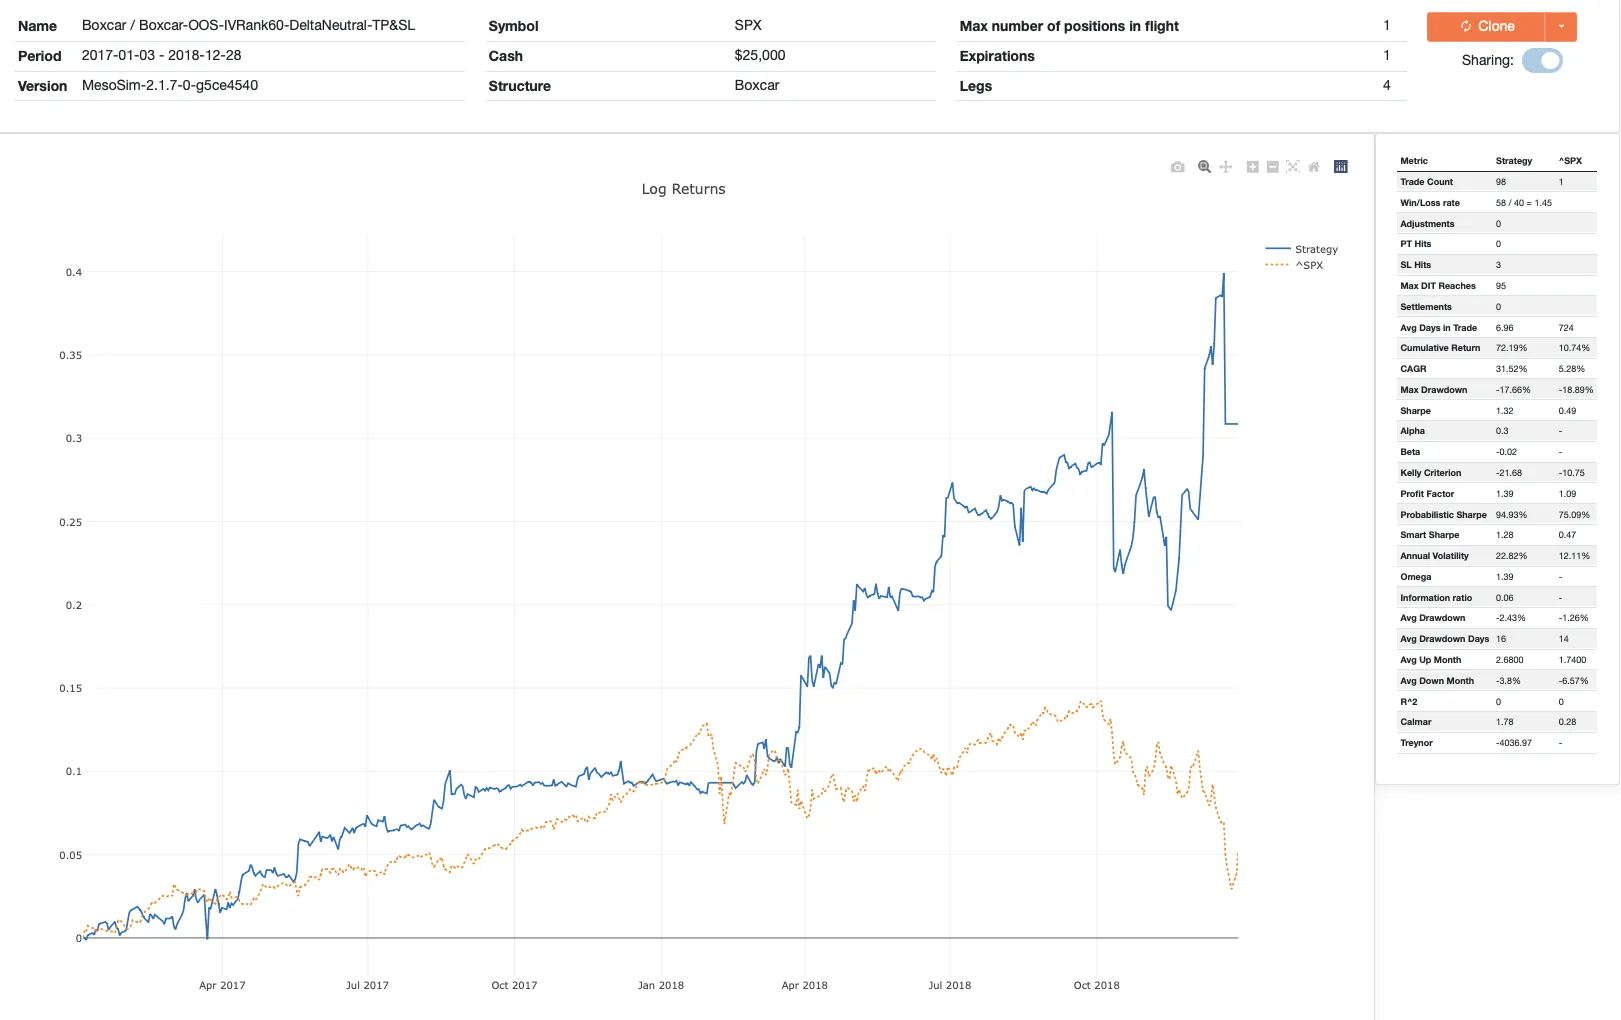
We will use the 2017-2018 time frame for our validation as it covers a grind-up and sideways market. We expect the OOS run to degrade somewhat regarding algo performance (Alpha, Beta, Sharpe). Our acceptance criteria will be that the overall performance Sharpe-wise (risk-adjusted return) outperforms the ^SPX buy-and-hold strategy.
The resulting run looks as follows: https://mesosim.io/backtests/a7bb0205-dbf4-453b-9882-23b1de6f836e
Summary
We have taken the Boxcar trade modeled in MesoSim and optimized it using market state and greeks. We identified that the IV Rank filter and Delta Neutral setup positively impact strategy performance. We combined the two optimizations and validated them using OOS data.
The resulting run seems promising regarding risk-adjusted return: Sharpe being 1.32 on Out of Sample data.
As the trade setup rules are now deviating from the original one, we name this trade Boxcar-NG.
The trades performance for the 2017 - 2022 period looks as follows:
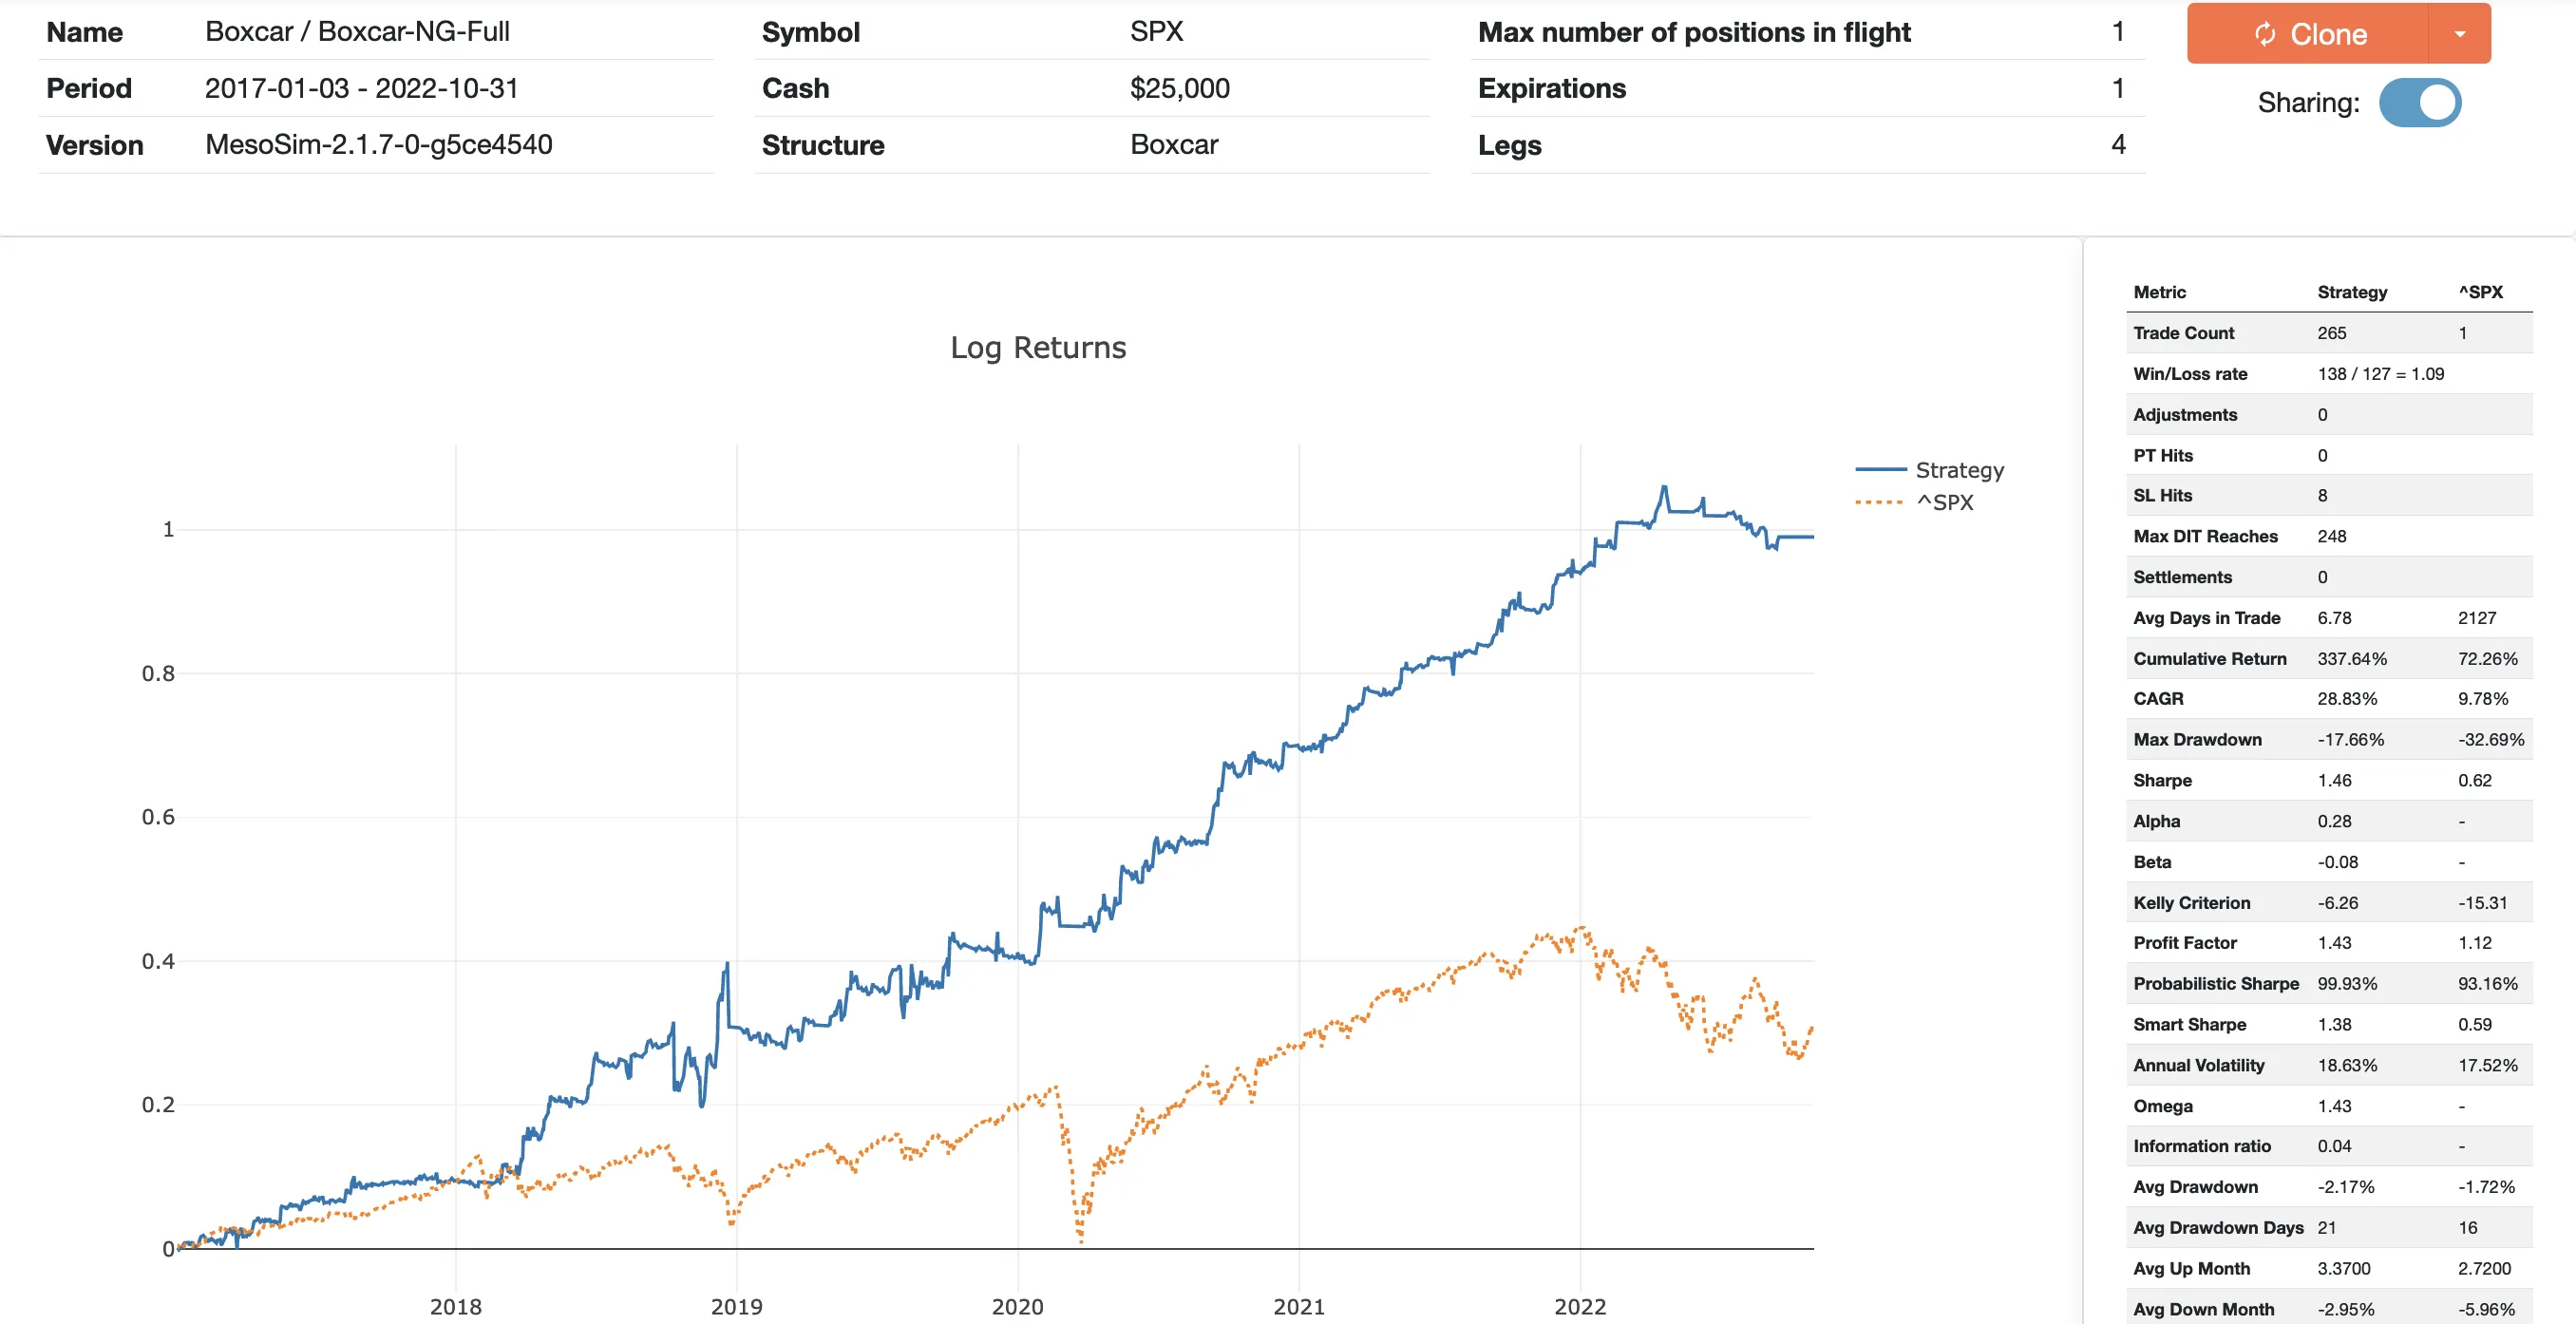
The associated run is available here: https://mesosim.io/backtests/1c8fffc3-f463-4736-9ec7-e4c88658aa94
The collected measurements, including the individual runs, are available via this sheet.
Thank you for reading through this long article, we hope you enjoyed the journey!
This article was originally written for MesoSim v2. The examples and terminology have been updated to match the MesoSim v3 Strategy Definition format. For details, see the MesoSim v3.0 release announcement and the v2→v3 migration guide. The performance metrics, described behavior, and referenced run results reflect the original v2 behavior. If you rerun the referenced strategies on MesoSim v3, results may differ slightly due to behavioral changes in the simulator.