Genetic Rhino: One Year Out of Sample

A year ago we published GeneticRhino-SPX-25Q4, a Rhino variant whose parameters were selected by a Genetic Algorithm. We closed that article with the hope that the trade "will hold up and provide good performance for the next few months". Since then the template has seen twelve months of data that did not exist when it was optimized, so now we can check.
We re-ran the unchanged built-in template from November 12, 2025 to November 17, 2026. It returned 15.6% on $250,000 with a Sharpe ratio of 1.99 and a maximum drawdown of -3.6%. SPX gained 7.1% in the same period, with a drawdown of -9.3%.
So the headline held up. How the trade earned that money is less obvious, and this is what most of the article is about.
- Forward test (Nov 12, 2025 – Nov 17, 2026): Sharpe 1.99, CAGR 15.3%, MaxDD -3.6%.
- The forward year continues at the level of the in-sample years outside of 2022 (Sharpe 1.94). 2022 itself was an exceptional year, with a Sharpe of 4.64.
- The trade made the same dollars per year as in-sample, with a third more daily volatility: one lot at SPX 7,200 is a bigger position than one lot at 4,900.
- 64% of the forward profit came from the January–April selloff and rebound. The quiet summer was the slowest period.
What we re-ran
The Strategy Definition is the GeneticRhino-SPX-25Q4 template as it ships in MesoSim, with the parameters we published in November 2025:
a 99 DTE put broken-wing butterfly with a call diagonal, leg moves when the position delta leaves ±5,
and an exit after 53 days, on a price breach, or when the delta goes beyond ±16.
The trade plan has the details.
The parameters are untouched, so this test shows how the 25Q4 optimization aged. Continuous re-optimization is a topic of its own, and we will cover it in a separate article.
- Simulator: MesoSim 3.3.8, fills at mid-price, $1.70 commission per contract. Slippage is covered below.
- Sizing: one structure per entry on a $250,000 account, a new position about every week. The position size does not grow with the account.
- Forward period: November 12, 2025 to November 17, 2026. It starts right after the in-sample period of the original article and ends on the most recent complete trading day in our data.
Here are all three periods on the same simulator version:
| Period | Role | Run | CAGR | MaxDD | Sharpe |
|---|---|---|---|---|---|
| 2018 – 2021 | Out-of-sample, older data | 1ed378c5-... | 9.17% | -6.46% | 2.38 |
| 2022 – Oct 2025 | In-sample | e7332009-... | 13.08% | -3.89% | 2.67 |
| Nov 2025 – Nov 2026 | Forward test | ab62b9ea-... | 15.33% | -3.63% | 1.99 |
Since MesoSim 3.2, statistics are calculated by MesoMetrics. The trades are the same as a year ago (193 trades and 281 adjustments in-sample), and the in-sample Sharpe now reads 2.67 where the original article shows 2.31.
The time of the daily NAV matters here. Calculated from the exported NAVs, the last NAV of each day gives 2.67, while the 10:00 NAV gives 2.34: the morning marks are more volatile (5.3% annualized against 4.7%).
To compare like with like, every number in this article comes from a run on MesoSim 3.3.8.
Why the out-of-sample period comes first
The table has an unusual order: the out-of-sample period is older than the in-sample period. This was a conscious decision when we set up the optimization.
The common way is to optimize on older data and keep the most recent years for validation. The trade that goes live is then tuned to a market that is already several years old. We did it the other way around. The Genetic Algorithm worked on the most recent data, 2022 to October 2025, and the older years, 2018 to 2021, were held back for validation. The two periods don't overlap, so the validation is just as valid. The difference is that the parameters are fitted to the market conditions closest to the ones the trade will meet next.
A year later we think this was a good decision. The parameters went into the forward year straight from the data that preceded it, and the trade performed in line with its most recent years. The forward test is also a second out-of-sample check for the trade, this time on the other side of the optimization window.
Forward results
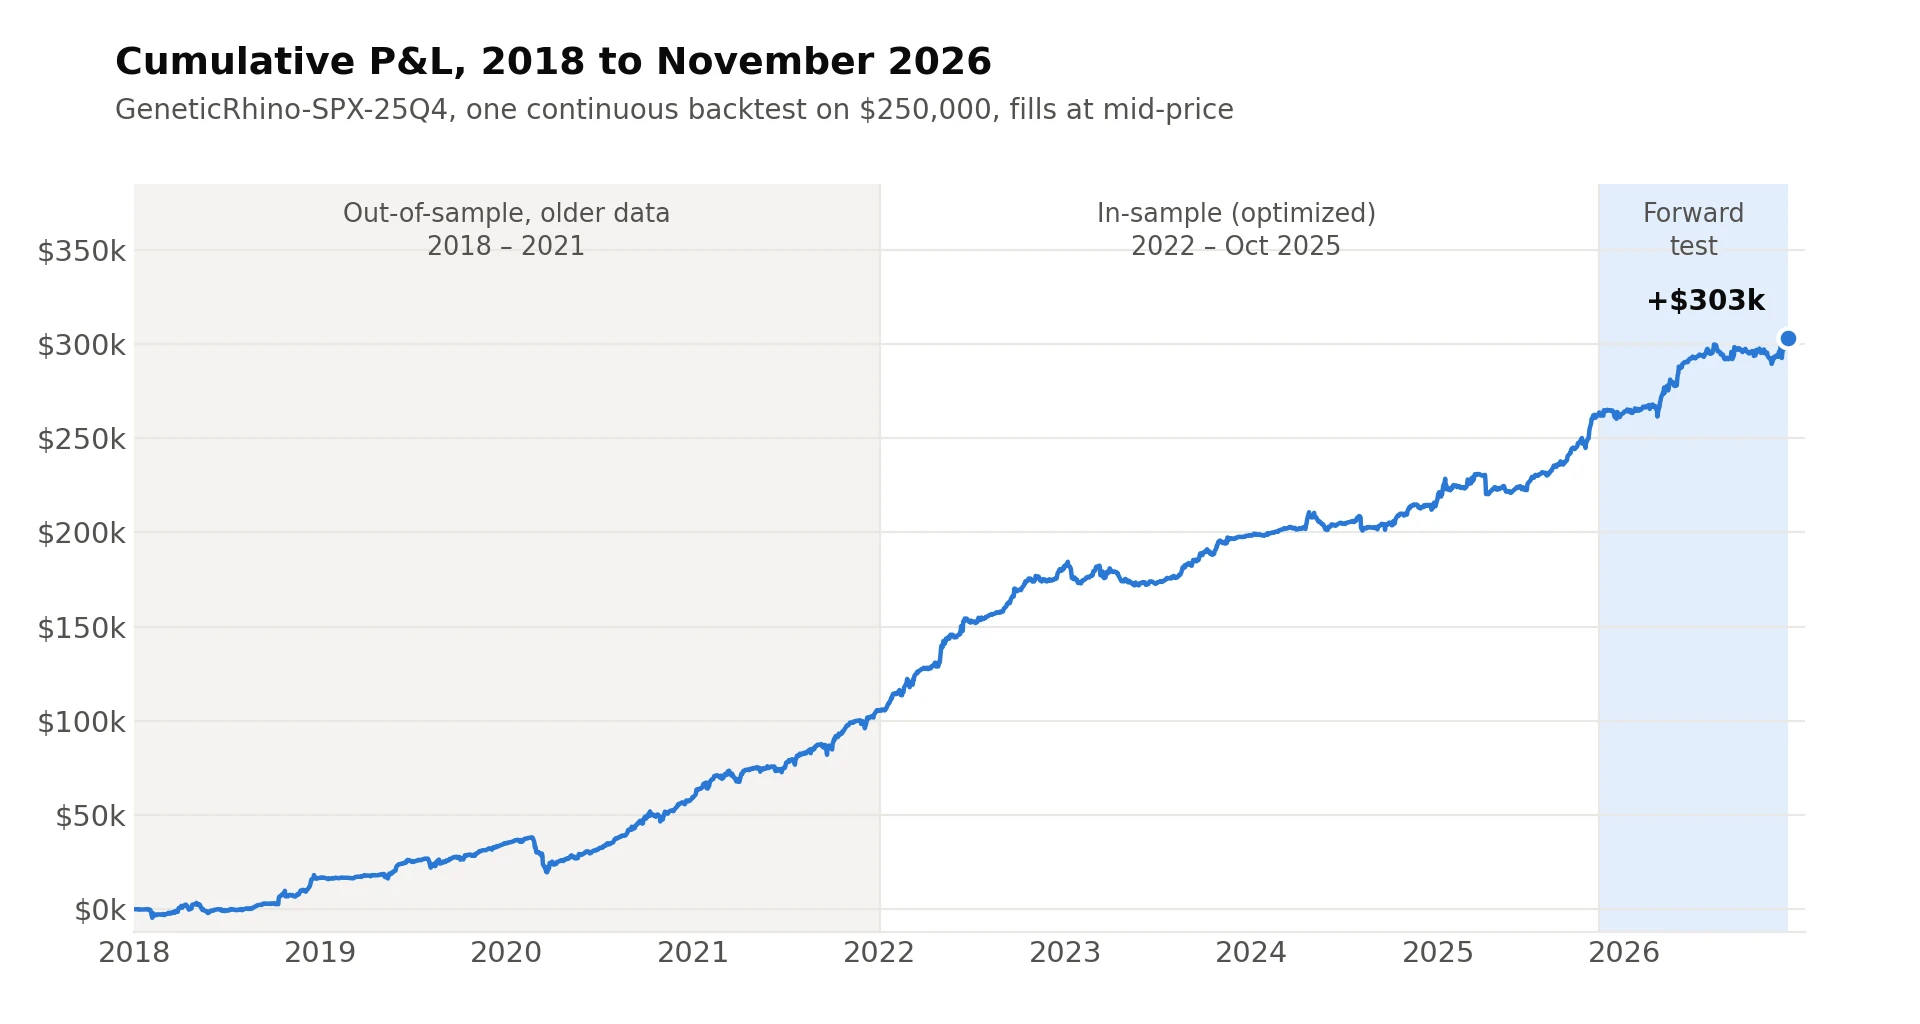
The chart shows one continuous run from 2018, so the forward test can be seen next to the data the optimizer used. In the forward test 47 positions were closed, 33 of them with a profit. Seven more were still open at the end and are marked to market.
The forward Sharpe of 1.99 is lower than the in-sample 2.67. With 254 daily returns the standard error of a Sharpe ratio is about 1.0, so one year of data can't tell 2.0 apart from 2.67. What it can tell is that the edge is still there: MesoSim reports a Probabilistic Sharpe Ratio of 97.9% for the forward test.
The yearly breakdown below says more than the single in-sample number. Before that, let's see what the results look like with slippage.
Slippage
In the original article we listed slippage modeling as further work. We also wrote that in our experience the trade can be filled with two orders, each slipping about 5 cents from the mid-price. We tested two ways to model this.
Fixed amount
"SlippageAmt": "0.05" moves every fill 5 cents away from the mid-price, on every contract.
A new position has six contracts, so it gives up 30 cents at entry. This is the simple and strict setting.
Spread-based
Since v3.2, MesoSim can calculate the slippage of a fill from the quotes of the order it belongs to. We used this expression, split over several lines here to make it easier to read:
order.combo_group_spread > 0
  and max(0.05, order.combo_group_spread * 0.05)
        * order.leg_spread / order.combo_group_spread
  or 0.05 / order.combo_group_leg_cnt
The same expression as it is written in the Strategy Definition
"SlippageAmt": "(order.combo_group_spread > 0 and max(0.05, order.combo_group_spread * 0.05) * order.leg_spread / order.combo_group_spread or 0.05 / order.combo_group_leg_cnt)"
In words: an order gives up 5% of its bid-ask width, but at least 5 cents, and every leg takes a share of this in proportion to its own bid-ask width.
The expression has four parts:
- The order. Legs with the same
LegGroupIdare traded as one order. The template has two of them at entry and at exit: the put butterfly and the call diagonal. An adjustment is one order as well: it closes a leg and opens its replacement. - What the order gives up:
max(0.05, order.combo_group_spread * 0.05).order.combo_group_spreadis the bid-ask width of the whole order, which is the sum of the widths of its legs. A leg that trades two contracts counts twice. The order gives up 5% of this width. The minimum is 5 cents, the amount we know from our own fills. - The share of a leg:
* order.leg_spread / order.combo_group_spread.order.leg_spreadis the bid-ask width of the leg that is being filled. A leg with a wide quote takes a larger part than a leg with a tight quote, and the parts add up to the amount of the order. - The safety net:
order.combo_group_spread > 0 and ... or 0.05 / order.combo_group_leg_cnt. MesoSim expressions are written in Lua, wherecondition and A or Bmeans "A if the condition holds, otherwise B". If none of the quotes in the order has a width, there is nothing to divide by, and the 5 cents are split evenly between the legs.order.combo_group_leg_cntis the number of legs in the order.
The first entry of the forward test, on November 12, 2025, shows how this works:
| Leg | Qty | Bid-ask width | Slippage per contract |
|---|---|---|---|
| Short put 6420 | -2 | $0.50 | 2.5¢ |
| Lower long put 5550 | +1 | $0.30 | 1.5¢ |
| Upper long put 6890 | +1 | $0.60 | 3.0¢ |
| Put butterfly | $1.90 | 9.5¢ | |
| Short call 7300 | -1 | $0.50 | 2.5¢ |
| Long call 7250 | +1 | $0.70 | 3.5¢ |
| Call diagonal | $1.20 | 6.0¢ |
The quotes of the butterfly add up to $1.90, because the short put counts twice. 5% of that is 9.5 cents. The upper long put has the widest quote and takes 3 cents of it. The lower long put has the tightest quote and takes 1.5 cents. The call diagonal is $1.20 wide and gives up 6 cents. The whole entry costs 15.5 cents, about half of the 30 cents of the fixed setting.
When an order is narrower than $1.00, 5% of its width is less than 5 cents, and the minimum applies. In the forward test this was the case for 146 of the 315 orders, most of them adjustments.
Results with slippage
| Period | Fills | Run | CAGR | MaxDD | Sharpe |
|---|---|---|---|---|---|
| 2022 – Oct 2025 | Mid-price | e7332009-... | 13.08% | -3.89% | 2.67 |
| Fixed 5¢ per contract | e80d4c28-... | 11.98% | -4.45% | 2.42 | |
| Spread-based | ad4e445f-... | 11.49% | -4.61% | 2.29 | |
| Forward test | Mid-price | ab62b9ea-... | 15.33% | -3.63% | 1.99 |
| Fixed 5¢ per contract | 826aaad6-... | 13.69% | -4.14% | 1.79 | |
| Spread-based | e7571161-... | 13.53% | -3.97% | 1.76 |
The forward test traded 832 contracts in 315 orders. The fixed amount costs $4,160, which is 11% of the mid-price profit. The spread-based model costs $4,564, or 12%. With either setting the forward Sharpe is close to 1.8.
The two settings cost about the same in total, but the spread-based model shows where the cost is paid:
| Orders in the forward test | Time (ET) | Count | Average slippage per order | Share of the total |
|---|---|---|---|---|
| Entries | 10:00 | 108 | 28¢ | 66% |
| Adjustments | 15:00 | 113 | 5.5¢ | 14% |
| Exits | 15:30 | 94 | 10¢ | 20% |
The quotes at 10:00, 30 minutes after the open, are much wider than in the afternoon. Most adjustments pay the 5 cent minimum, while two thirds of the slippage is paid at entry.
The forward year was a typical year
The yearly breakdown of the continuous run puts the in-sample Sharpe of 2.67 into context:
| Period | SPX | P&L | Sharpe |
|---|---|---|---|
| 2018 | -7% | $16.7k | 1.86 |
| 2019 | +29% | $18.2k | 2.57 |
| 2020 | +16% | $24.4k | 2.00 |
| 2021 | +28% | $46.1k | 3.06 |
| 2022 | -20% | $77.1k | 4.64 |
| 2023 | +25% | $16.1k | 1.33 |
| 2024 | +23% | $21.6k | 1.71 |
| 2025, Jan – Oct | +17% | $42.0k | 2.74 |
| Forward test | +7% | $39.9k | 1.95 |
The forward row is taken from the continuous run, which enters the period with positions already open. This is why it differs slightly from the standalone forward test (1.99 and $38.9k). The SPX change is measured on the backtest's own price marks, 15 minutes before the close, so it can differ slightly from close-to-close returns.
2022 stands out. It produced half of the profit made between January 2022 and October 2025, $77k of $157k, at a Sharpe of 4.64. In the positions closed that year, the put butterfly legs earned $108k while the call legs lost $35k. A slow decline keeps moving the price toward the short strikes of the butterfly, where the structure pays the most.
For the rest of the in-sample period, January 2023 to October 2025, the Sharpe is 1.94. The forward year, at 1.95, continues at the same level, and it is close to the median of the nine rows above (2.00).
So we read the forward result as the trade doing what it has done in most years, rather than as a decline from 2.67. This is also what the Deflated Sharpe Ratio in the original article prepared us for: it discounted the in-sample Sharpe of 2.31 to 1.15 (both on the earlier metrics), and the forward year came in well above that.
Same dollars, bigger position
The CAGR is higher in the forward test, 15.3% against 13.1%. This comes from the arithmetic of a fixed position size and not from a change in the trade.
The in-sample run made $150.4k in 3.8 years, which is $39.3k per year. The forward test made $38.9k in one year. The trade earned the same dollars. The in-sample CAGR is lower because the position size is fixed while the account grows from $250k to $400k. The forward test starts from $250k again.
What did change is the size of one lot:
| In-sample | Forward test | Change | |
|---|---|---|---|
| Average SPX level | 4,930 | 7,240 | +47% |
| Theta of a new position, per day | $25 | $36 | +44% |
| Volatility of daily P&L, annualized | $14.9k | $19.8k | +33% |
| P&L per year | $39.3k | $38.4k | -2% |
| P&L per year / notional of one lot | 8.2% | 5.6% |
The notional of one lot is the SPX level multiplied by 100. The same dollar return on a third more volatility is the whole move in the Sharpe ratio: 2.67 divided by 1.33 is 2.0.
There is a practical side to this. The template's Cash of $250,000 was chosen when SPX was much lower.
If you size the trade by the number of contracts, the risk per account dollar grows with the index.
To run the template at its in-sample volatility, one lot needed about a third more capital in this backtest, roughly $330,000.
The profit came from the selloff, not from the quiet months
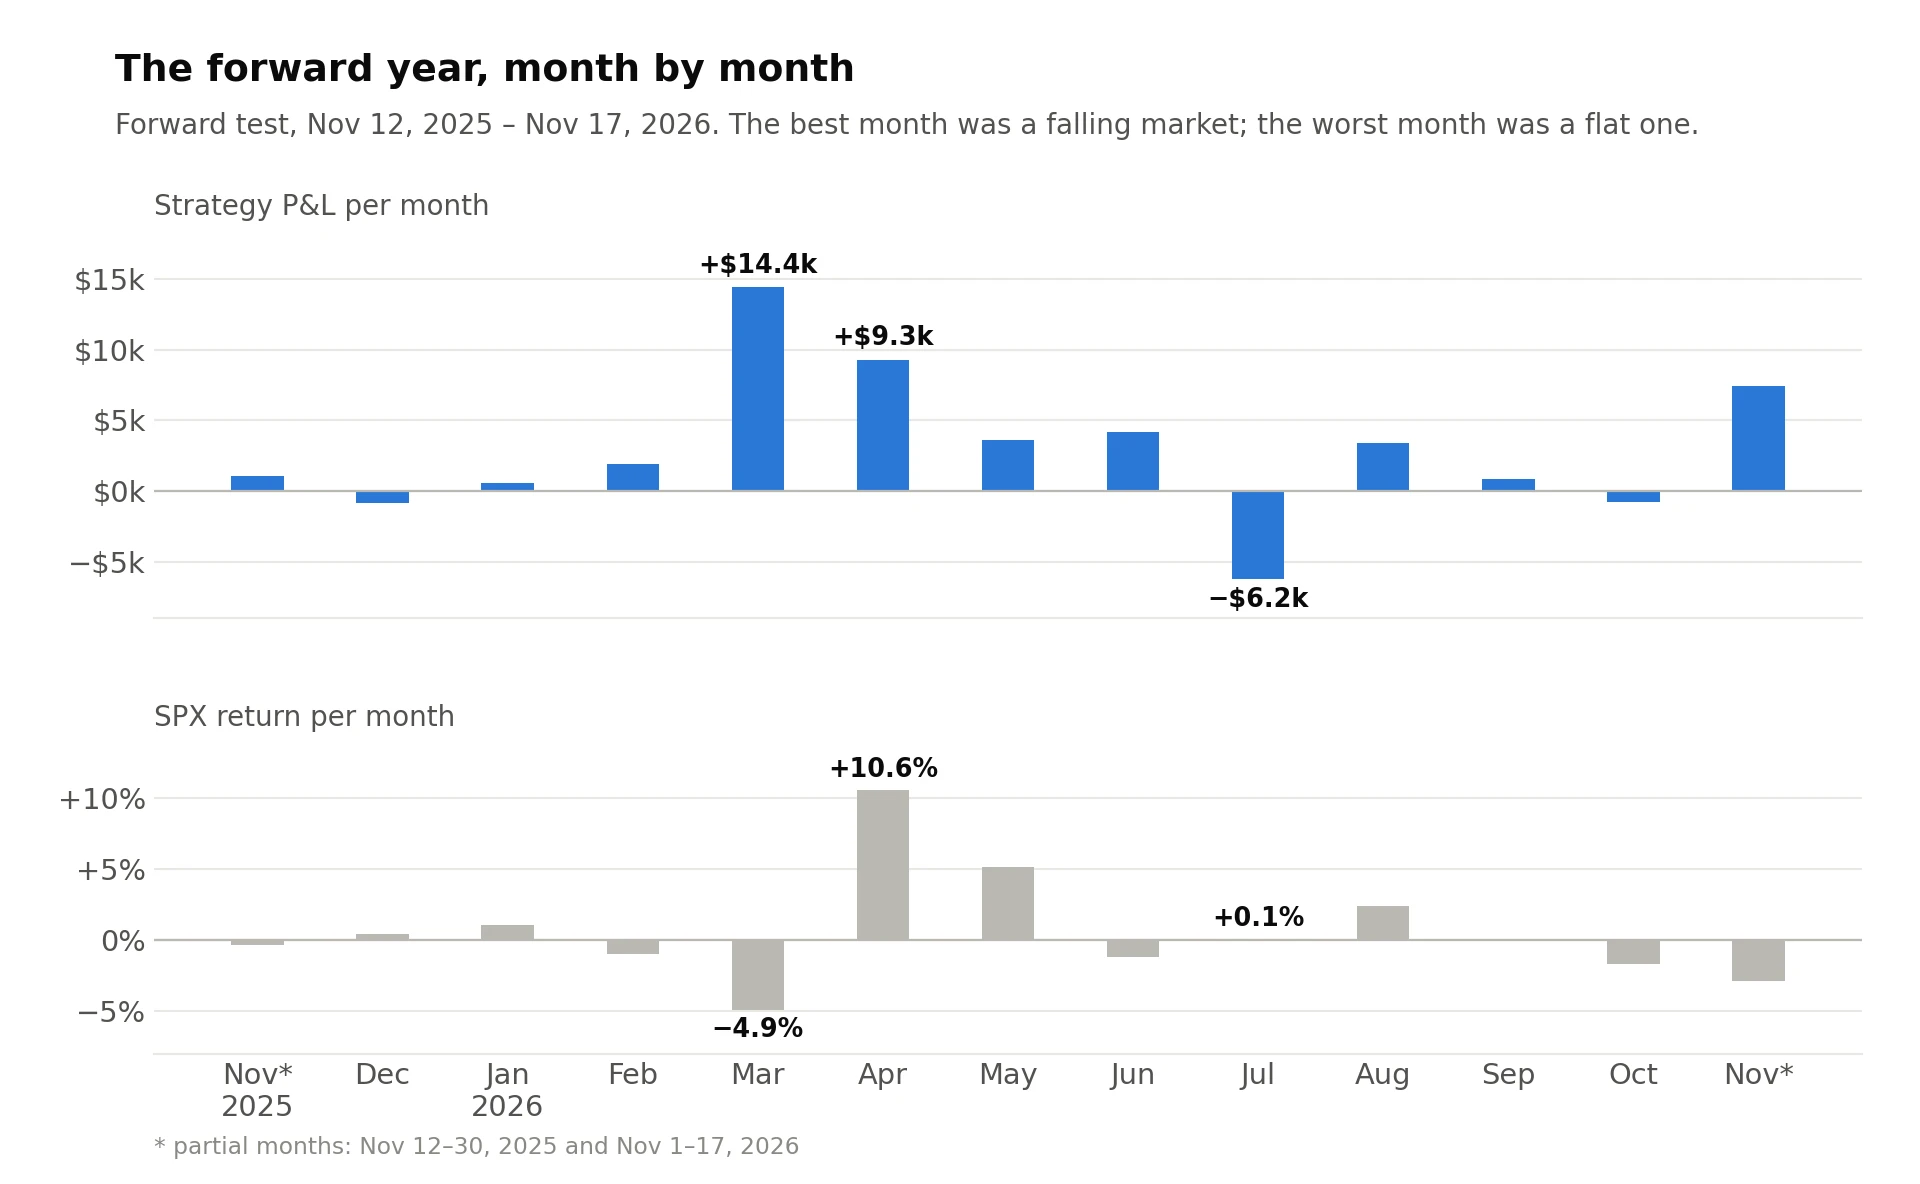
SPX peaked on January 27 at 6,983, fell 9.3% to 6,331 by March 30, and was back at 7,217 by the end of April. The strategy made $13.7k on the way down and $11.2k on the way back up. This is 64% of the forward profit, earned in three of the twelve months.
Its own maximum drawdown came later, and not in a selloff. Between June 25 and October 16 the strategy gave back $10.4k while SPX moved from 7,348 to 7,646. July was the slowest month with -$6.2k, and SPX ended that month where it started.
This may be surprising for a butterfly income trade, but the full history shows the same pattern. In the 2018–2026 run there are 19 calendar months in which SPX gained between 0 and 2%. The strategy made $59 on average in them. In the other 87 months it made $3,474 on average.
The forward year had more of the quiet kind:
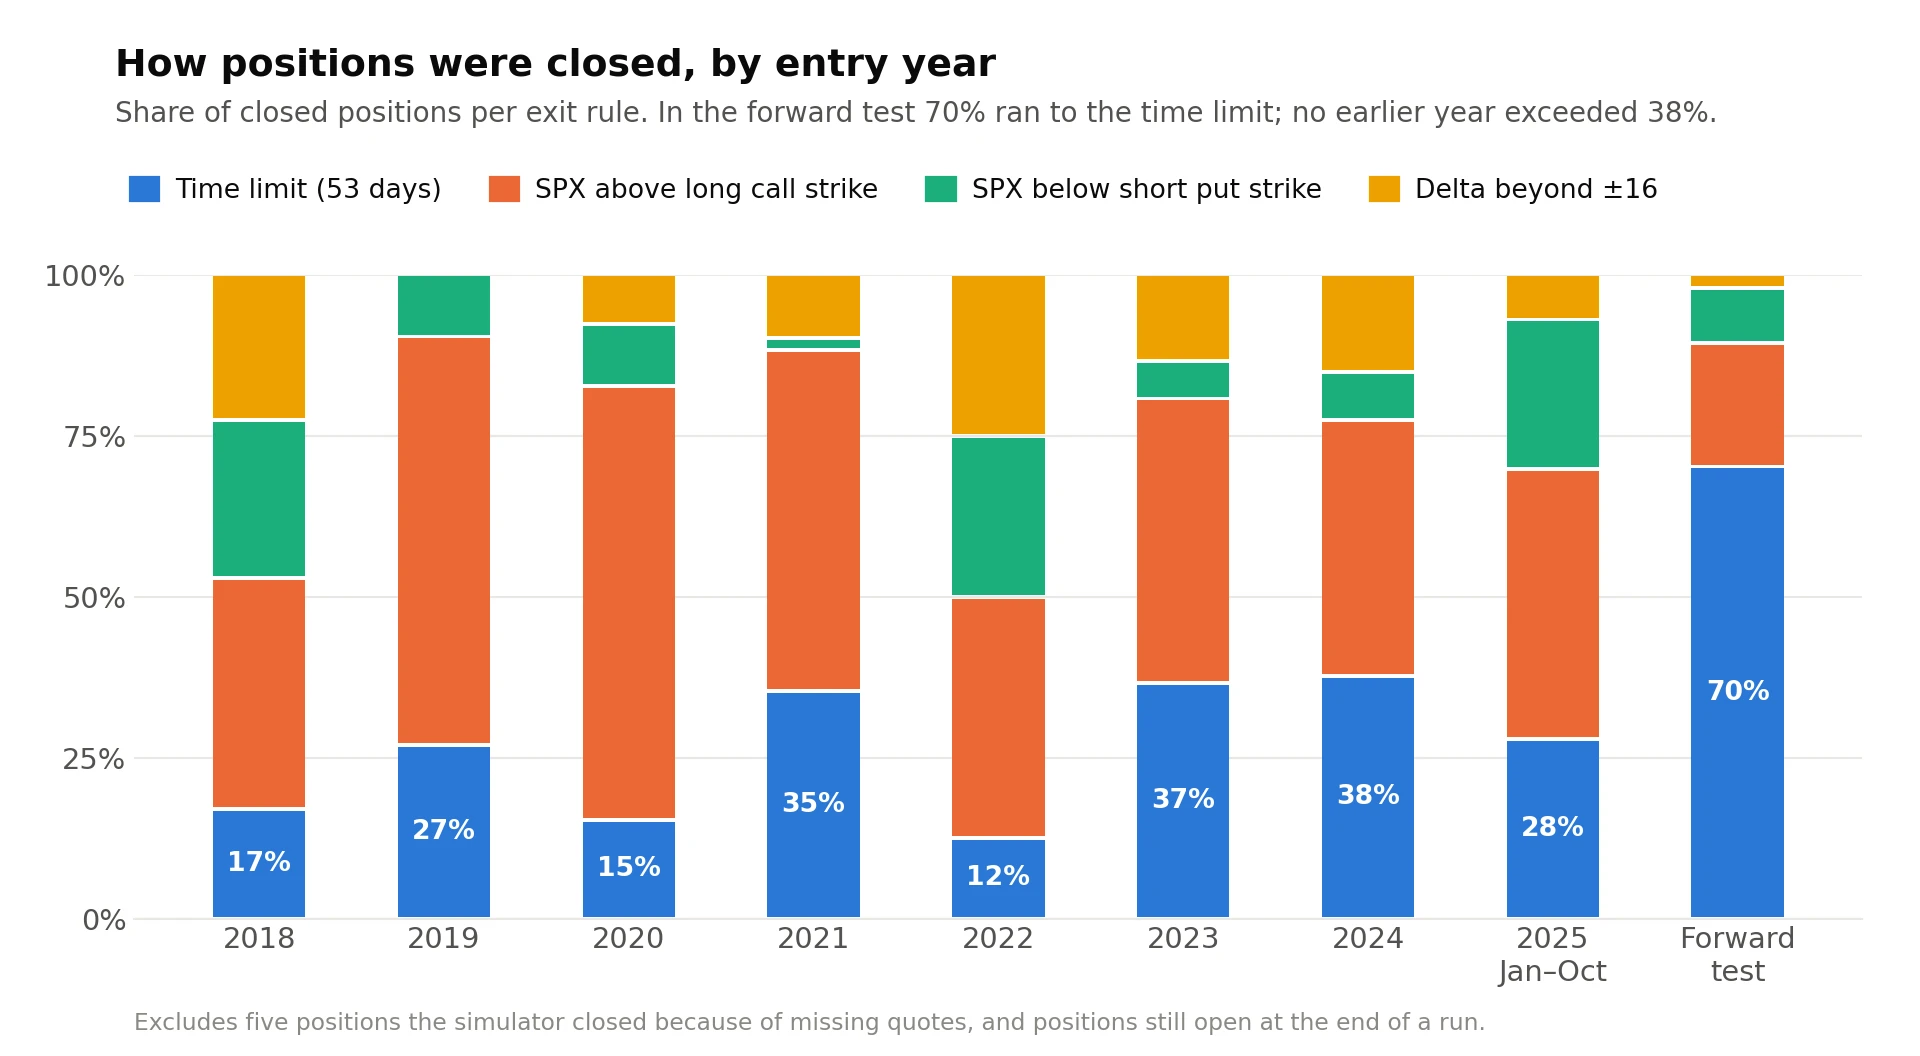
In the forward test, 70% of the positions ran to the 53-day time limit. In earlier years this was never more than 38%. Almost half of the positions (22 of 47) were closed with SPX between -1% and +3% from where it was at entry, compared to 13% before November 2025. Those 22 positions lost $88 on average. The other 25 made $1,337.
Older positions carry more vega and less theta
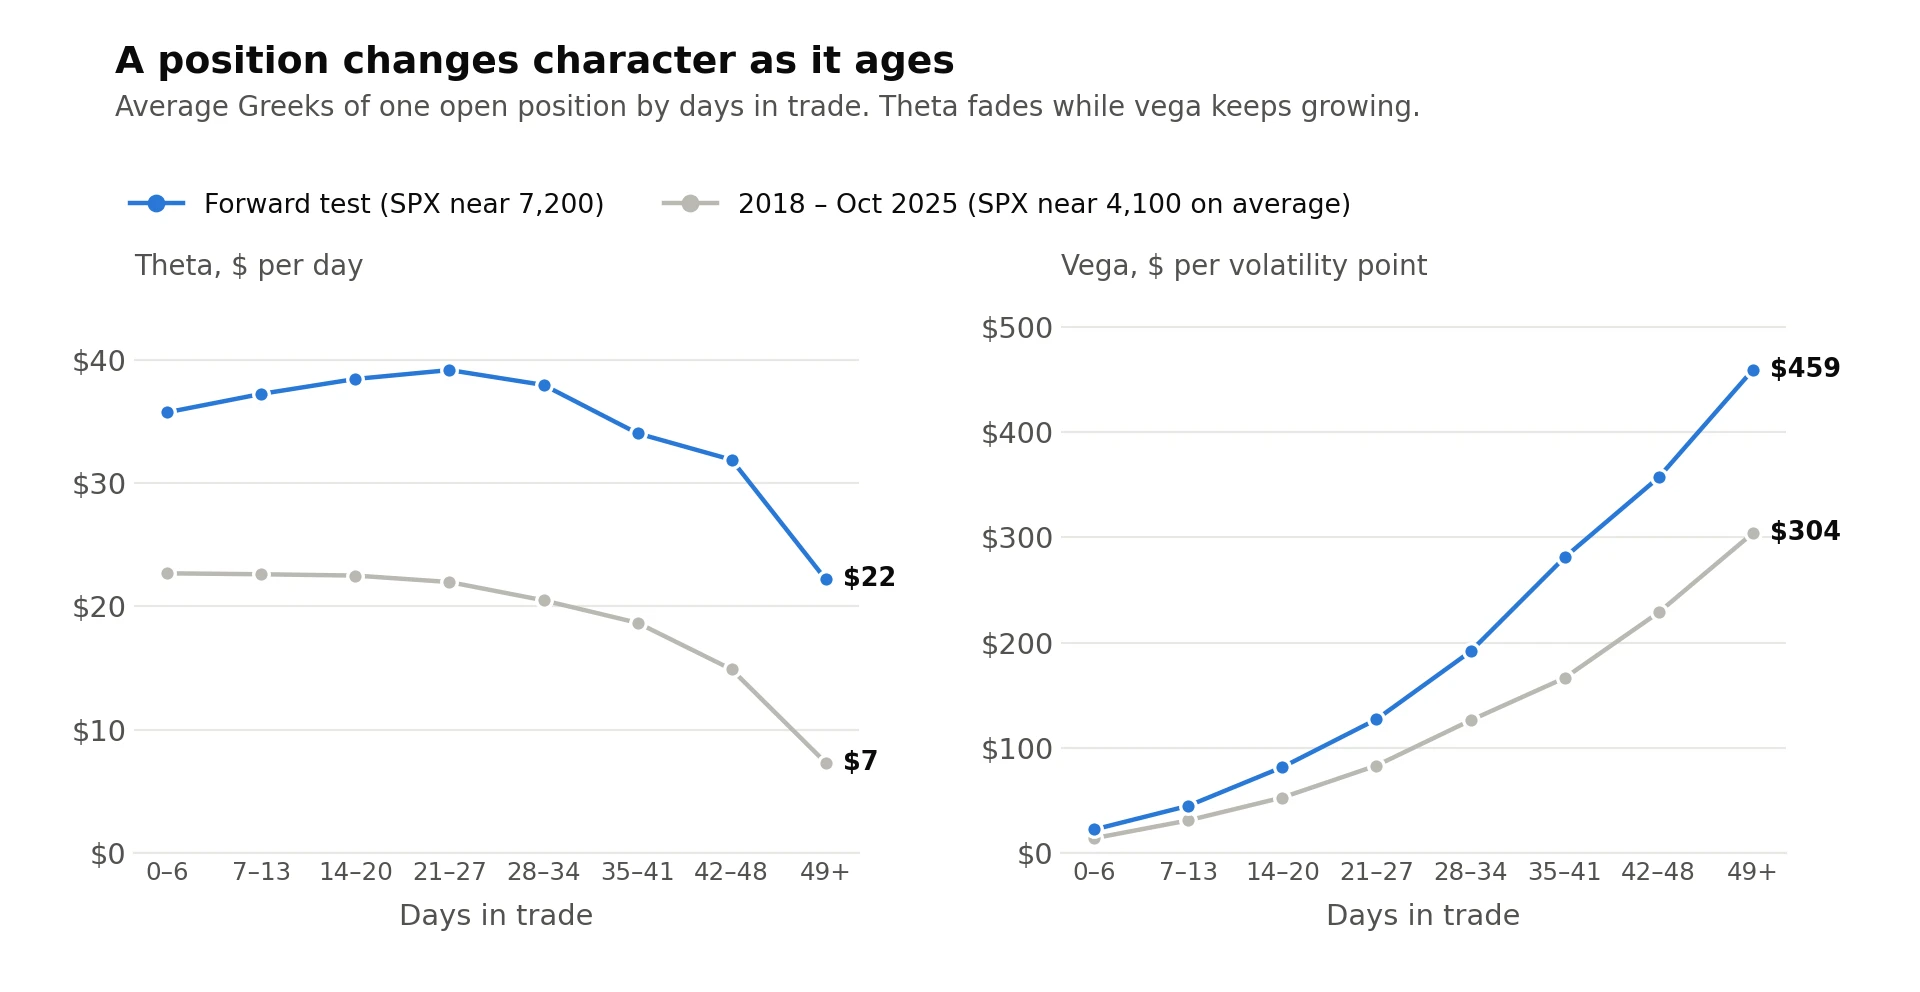
A new position in the forward test has about $36 of theta per day and almost no vega. After day 49 the theta is down to $22, the vega is up to about $460 per volatility point, and 45% of the daily snapshots show negative theta. The earlier years have the same shape at a smaller size.
The delta rule is behind this. Each time the position delta falls below -5, the short call is moved further from the money. There it offsets less of the long call's vega and collects less theta. This happened 1.7 times per position in the forward test, against 1.0 in-sample. In 43 of the 457 positions of the continuous run, one of these moves put the short call at a strike worth less than $1. After that the short call offsets very little of the long call.
The best trade of the forward test shows this most clearly:
- March 2: entry with SPX at 6,845.
- March 31: after the selloff, with SPX at 6,512, the rule moves the short call from 7300 to 8800 for a credit of $0.225. From this point the call diagonal is a long 7210 call on its own.
- April 9 – 24: SPX rallies to 7,160 and the position delta turns positive. The other rule moves the upper long put on 12 trading days in a row.
- April 24: exit on day 53 with +$8,770. At that point the position has a theta of -$139 per day, a vega of +$1,553 and a delta of +16.
This one position is 28% of the P&L of all positions closed in the forward test.
The example shows where the money came from in the spring: long vega and a long call, rather than theta. We think the same mechanism is behind the slow quiet months. Old positions carry a lot of vega and little theta, so when nothing moves there is not much left to earn. This is our reading of the data, not a separately tested result.
What we take from it
The published parameters have now been tested on data from both sides of the optimization window, 2018–2021 and the last twelve months, and they held in both. At mid-price the forward Sharpe is about 2. With slippage it is about 1.8.
For anyone trading or studying the template:
- A Sharpe of about 2 at mid-price is the realistic expectation. This is what the trade delivered in the forward year and in the in-sample years other than 2022.
- Size by notional, not by contract count. One lot is about 47% larger than it was on average in-sample.
- Quiet markets are the slow periods of this trade. In the last weeks of a position its vega matters more than its theta.
- Entries carry most of the slippage. The quotes at 10:00 ET are wider than in the afternoon.
The review also leaves two questions for the optimizer. Would a minimum delta on the short call in the adjustment keep more theta in older positions? And is 53 days the best time limit, given how the Greeks shift in the last weeks? Both would change how the trade behaves in a selloff, which is where the forward profit came from, so the answer is not obvious. We would rather add them to the decision space of the optimizer than change the rules by hand. We will come back to this in an upcoming article about continuous re-optimization.
All runs are linked above. You can clone the forward test to check the numbers or to extend the period.
Do you have other ideas or suggestions?
Please leave a comment below!