
MesoSim v3.2: Portfolio Builder and AI Researcher
We are excited to introduce MesoSim-v3.2, our biggest release yet. Key features:
- Agentic Research
- Portfolio Builder with delta hedging
- StatSim, our statistical simulations module
- API Access for retail users
Agentic coding is becoming an important part of quantitative research:
agents can write analysis code, run backtests, and use the results to guide the next experiment.
FundPro customers have been enjoying AI-driven development since 2024, and now we're opening this capability to retail customers as well. With our OpenAI Codex and Claude Desktop / Claude Code plugins, you can use MesoSim directly from your favorite environment.
The portfolio and simulation improvements let you model more aspects of how you would trade a portfolio live.
New features
Agentic Research
Retail users on the Advanced plan can now access the MesoSim API and use it through their own AI agents. Our Codex and Claude plugins let your agents create strategies, run tests, and analyze results.
FundPro customers will also get access to our new AI Researcher.
AI Researcher was built for quantitative research with a focus on options.
It can iterate on strategies autonomously and validate them quickly using FundPro's dedicated capacity.


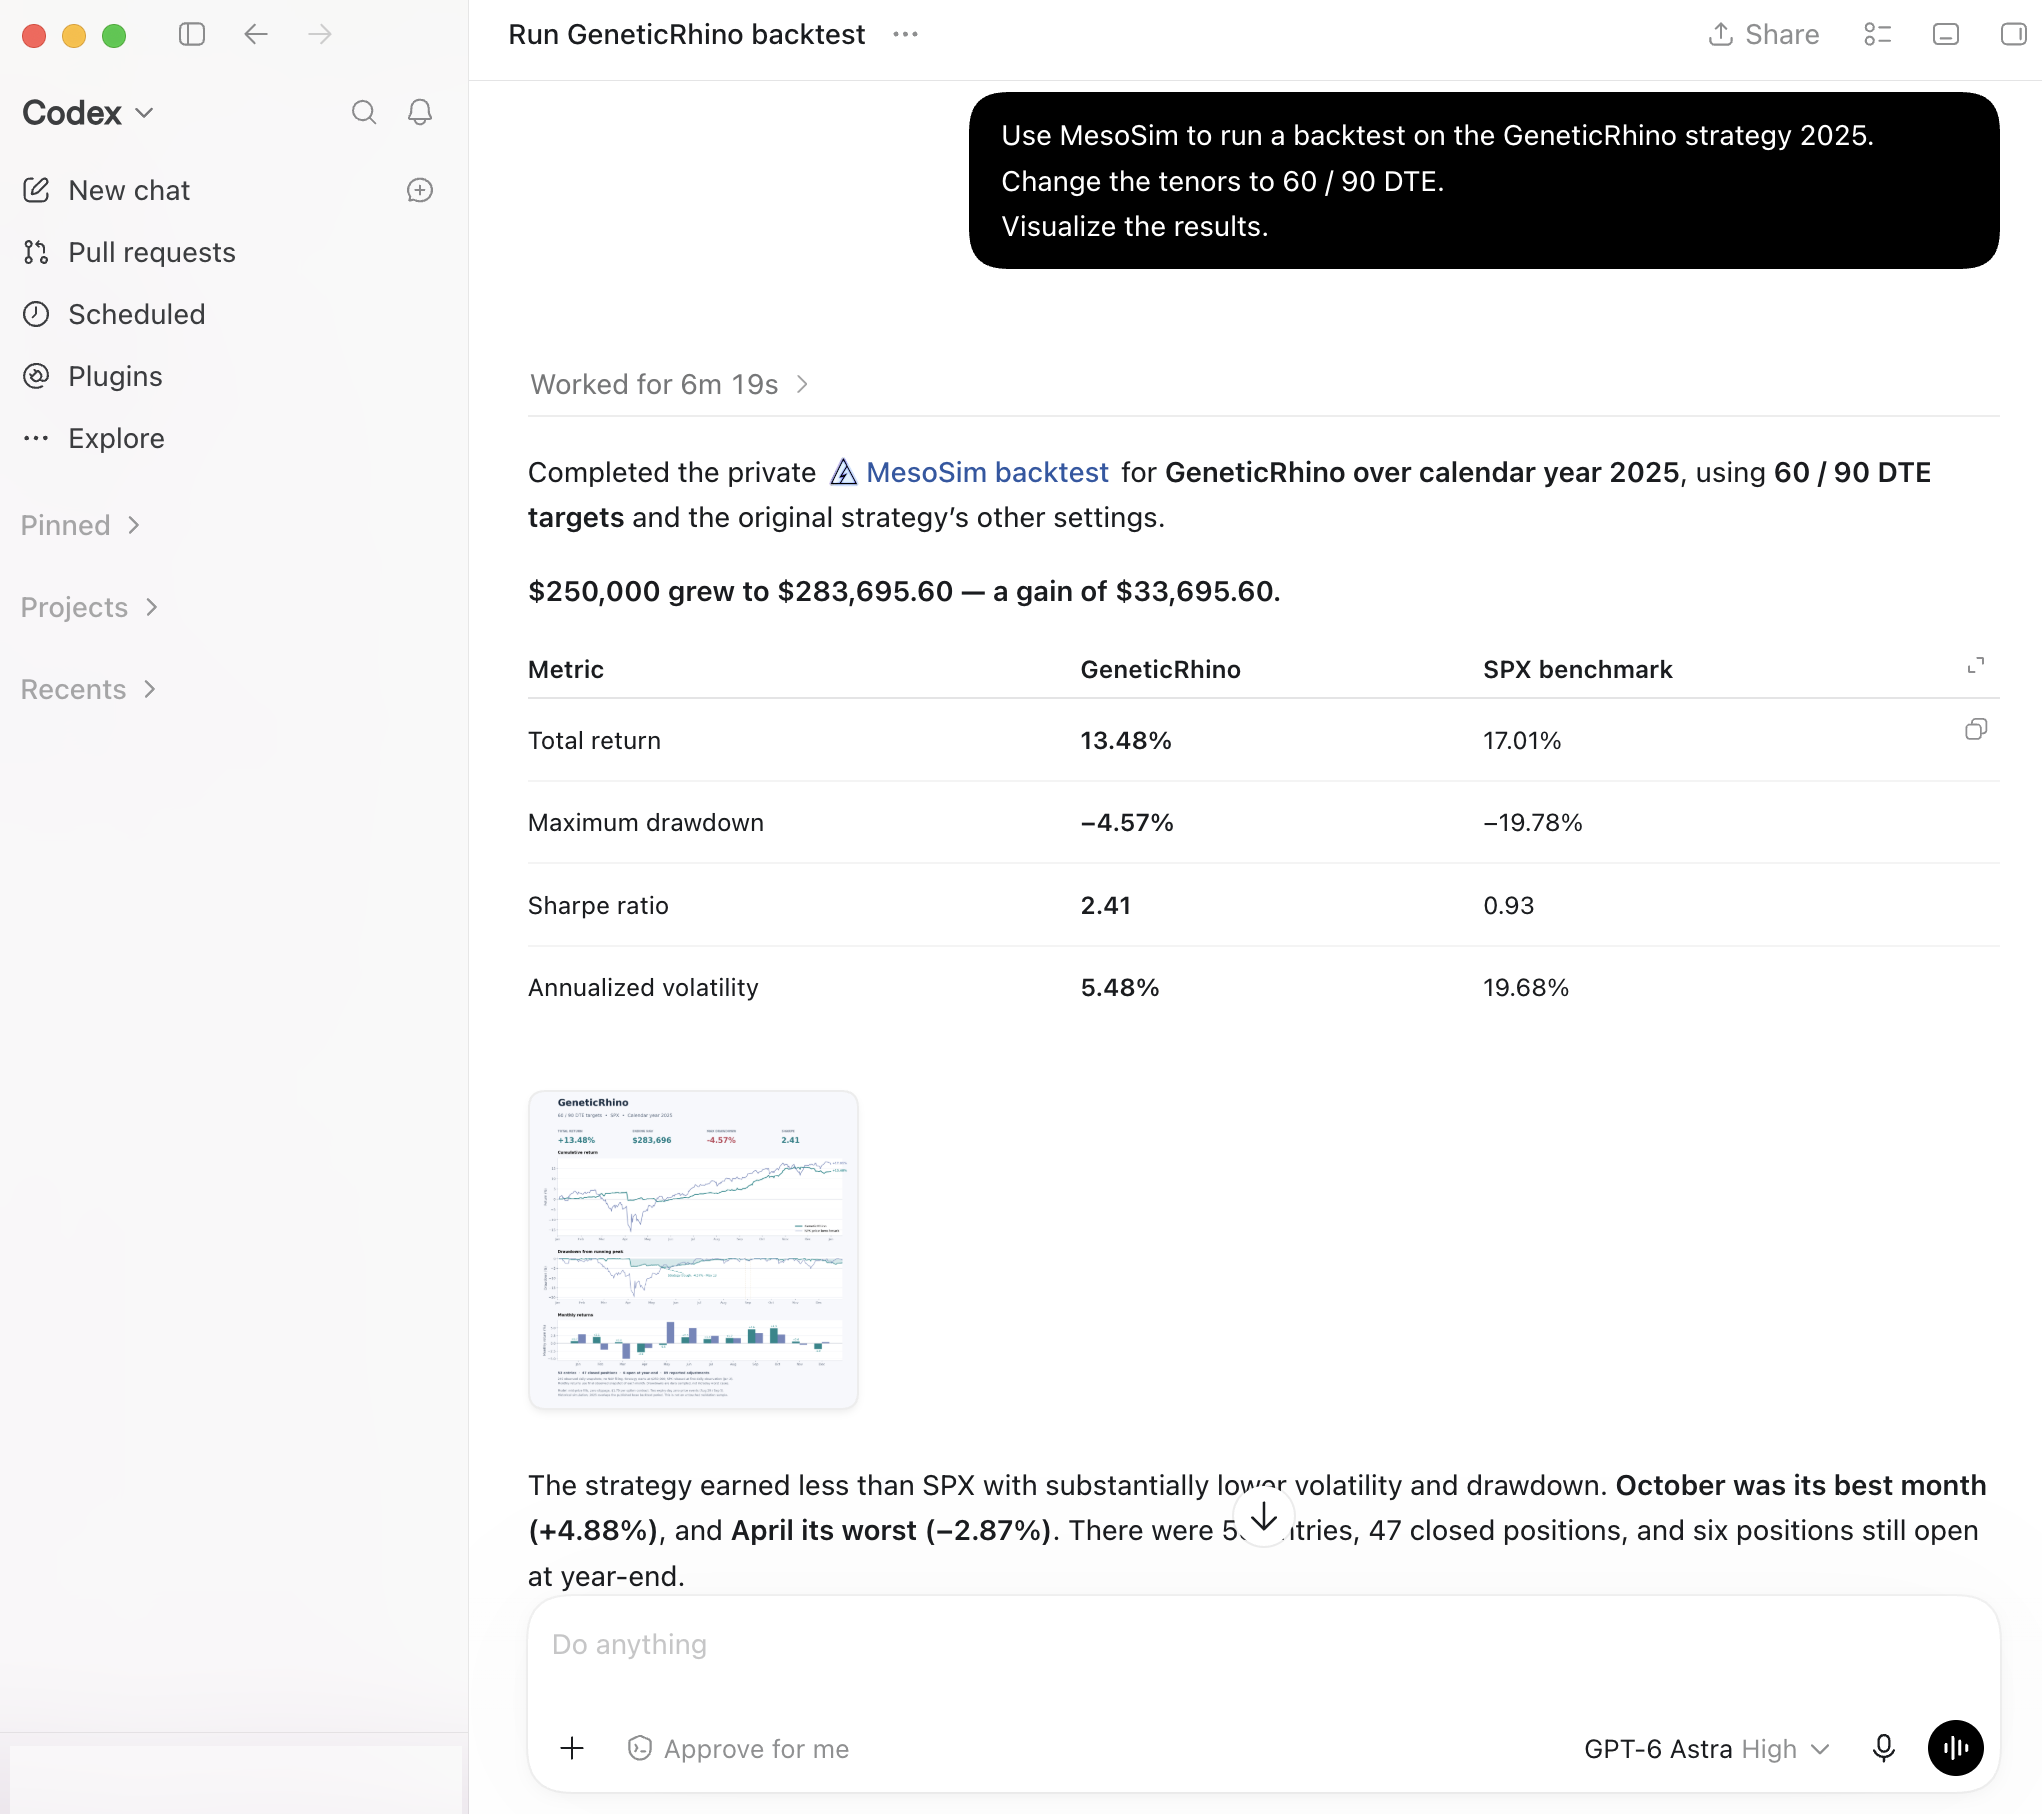
A request in Codex changes GeneticRhino's expiration targets and returns a backtest summary with charts.
On the retail instance, you can have up to four backtests running concurrently, with the limit shared between the API and the UI. We will monitor system utilization during the first few weeks and may introduce backtest quotas later if needed to manage the load.
Automation through the UI remains prohibited. Use the official API for automated workflows; see Deltaray's Terms and Conditions.
For testing at a larger scale, we recommend FundPro, which provides 25 times the backtesting throughput of the Advanced plan. Alongside AI Researcher, FundPro includes machine-learning-based entry filtering, SQL-based analytics, MesoLive API access, and additional research tools.
Portfolio Builder
Diversification is important in trading. Combining strategies with low correlations can yield better results than trading a single strategy alone.
Options traders often use delta hedging to reduce directional risk in their portfolios. Every hedge comes with a cost. Hedging too frequently can erode profits, while hedging too infrequently leaves you exposed.
Portfolio Builder brings these decisions into MesoSim, so you can study different portfolio compositions.
To use your existing strategies in Portfolio Builder, rerun them with MesoSim v3.2.
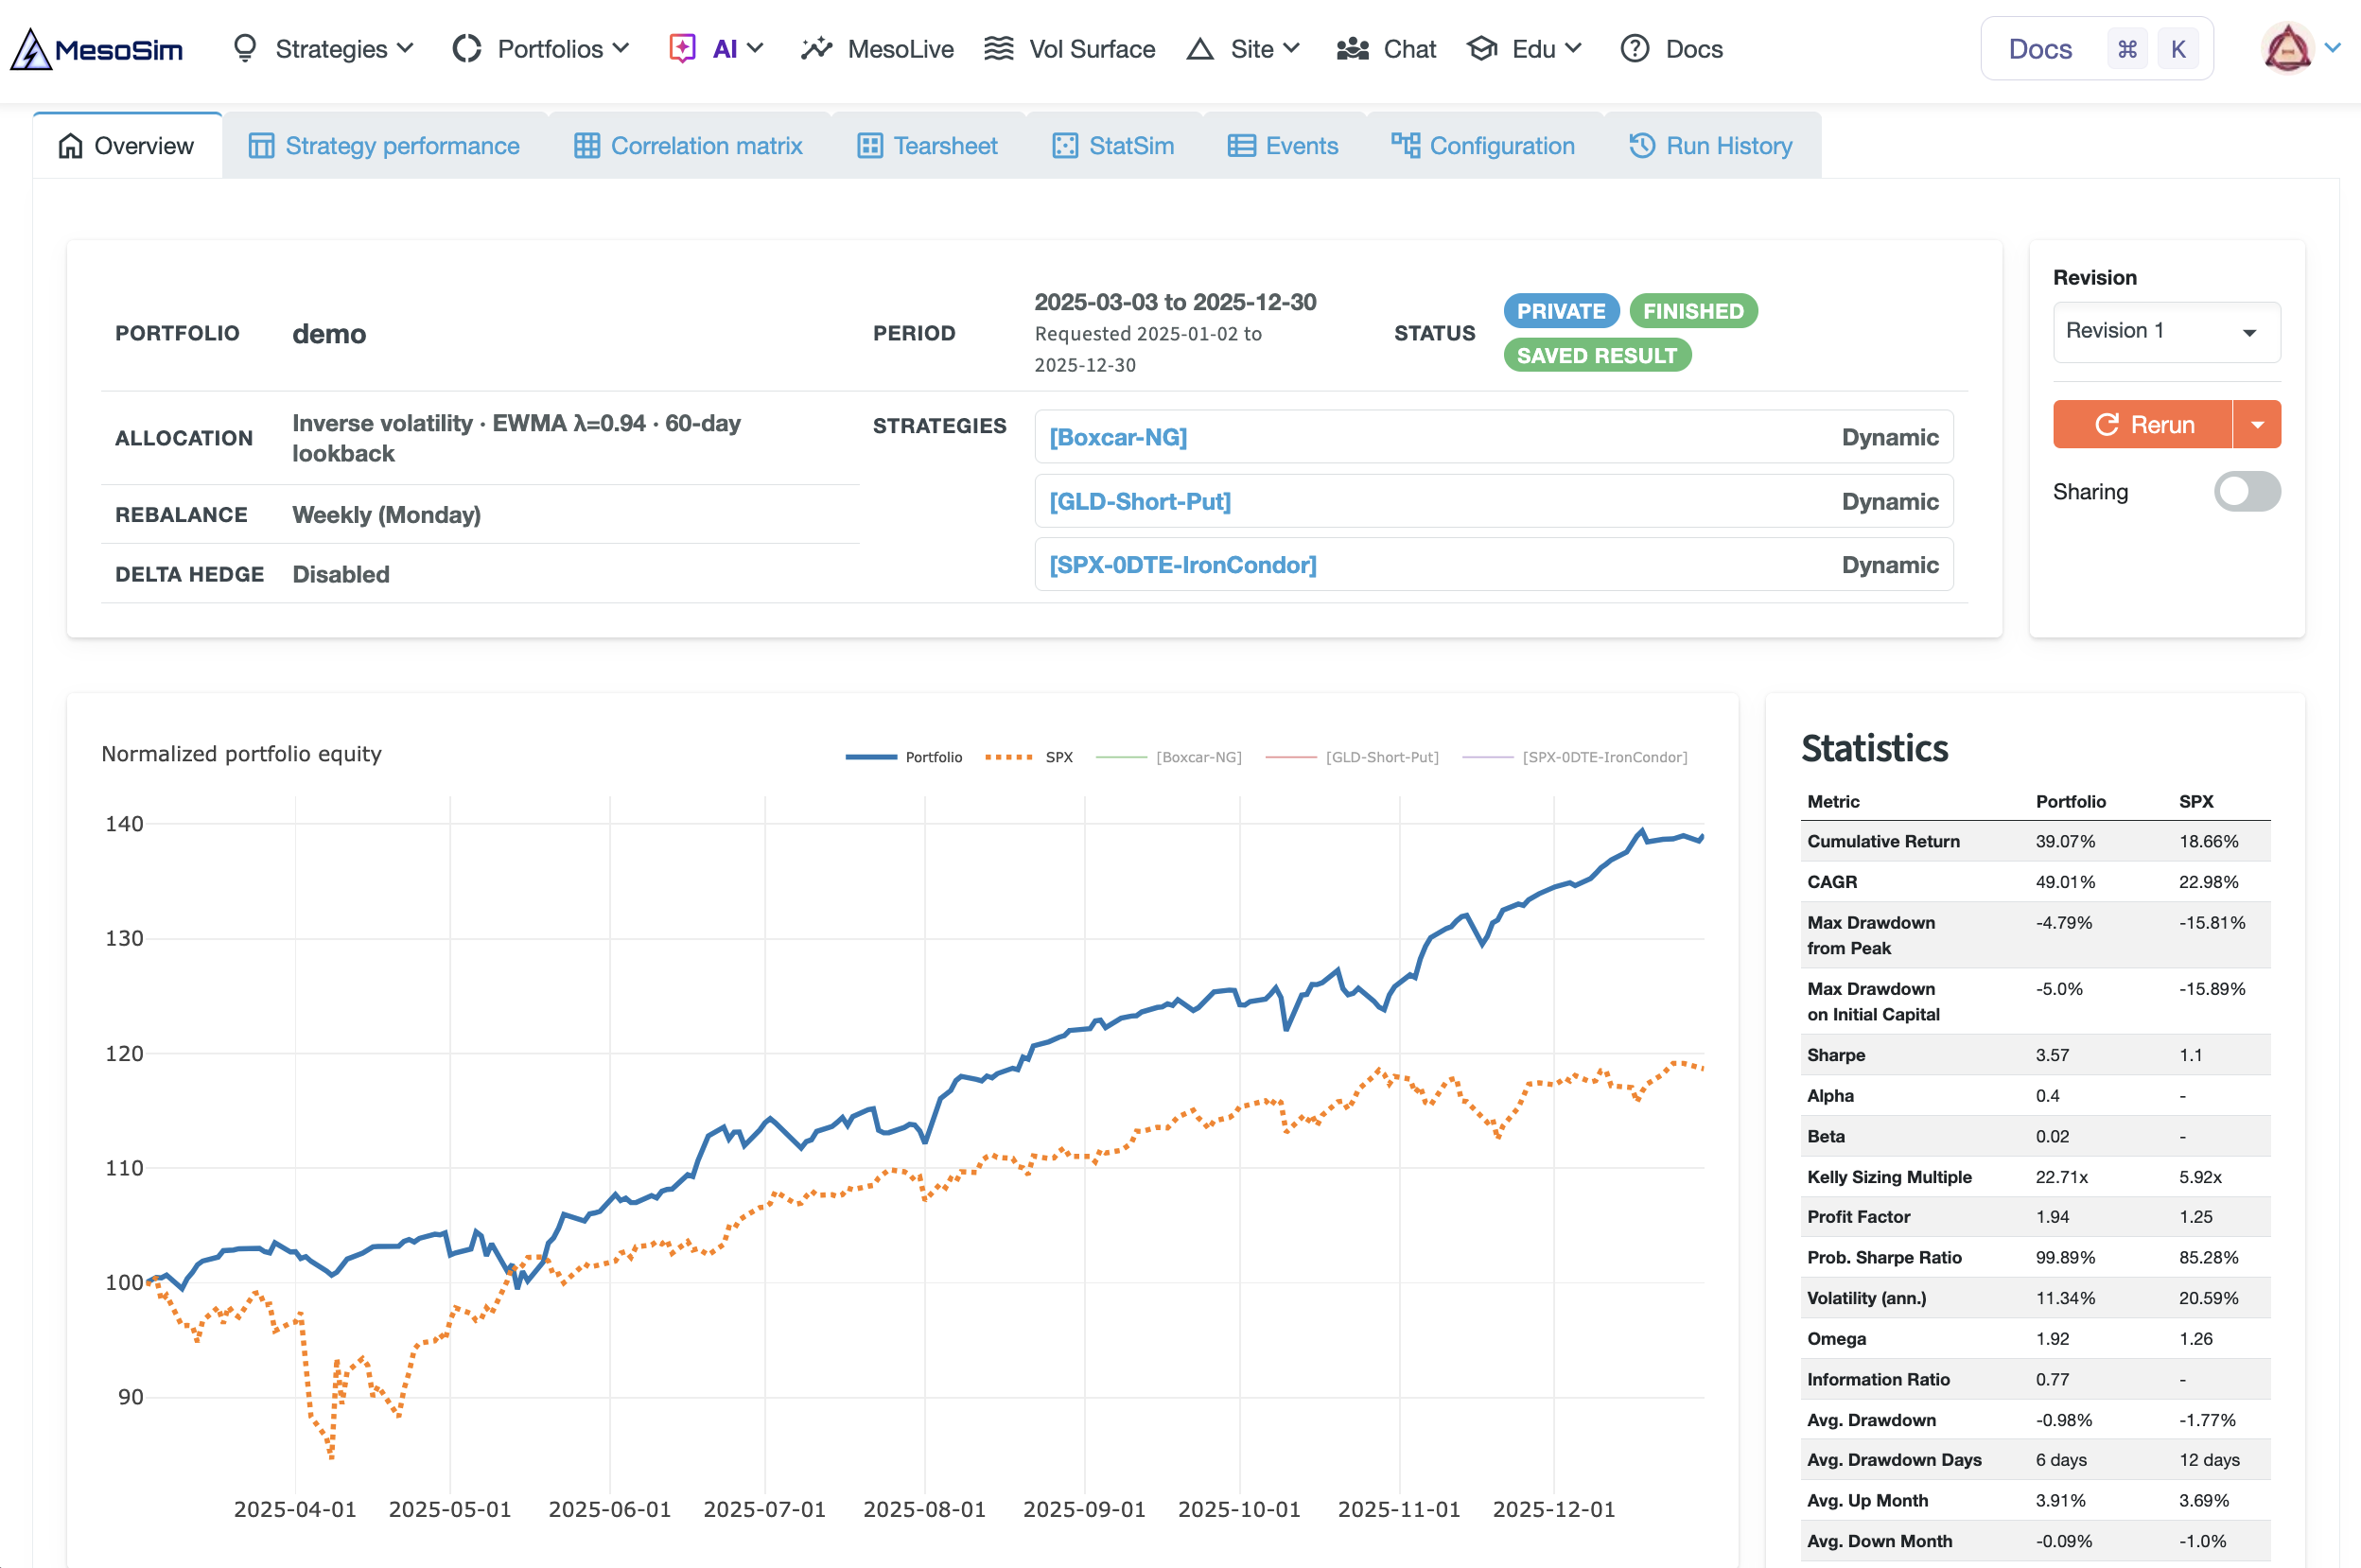
The overview brings allocation settings, the combined equity curve, and portfolio statistics into one view.
Select the backtests you want to combine and define an analysis period. Portfolio Builder then lets you:
- Choose fixed weights or inverse-volatility sizing.
- Keep the initial allocation or rebalance daily, weekly, or at a custom interval.
- Inspect combined performance, strategy correlations, and portfolio Greeks by underlying.
- Apply delta hedging with configurable triggers, targets, frequency, commission, and slippage, then compare hedged and unhedged results.
- Use StatSim to test the statistical significance of the portfolio's mean return.
You can evaluate whether adding a strategy improves the combination, save the portfolio, and rerun its strategies over another period without rebuilding the composition.
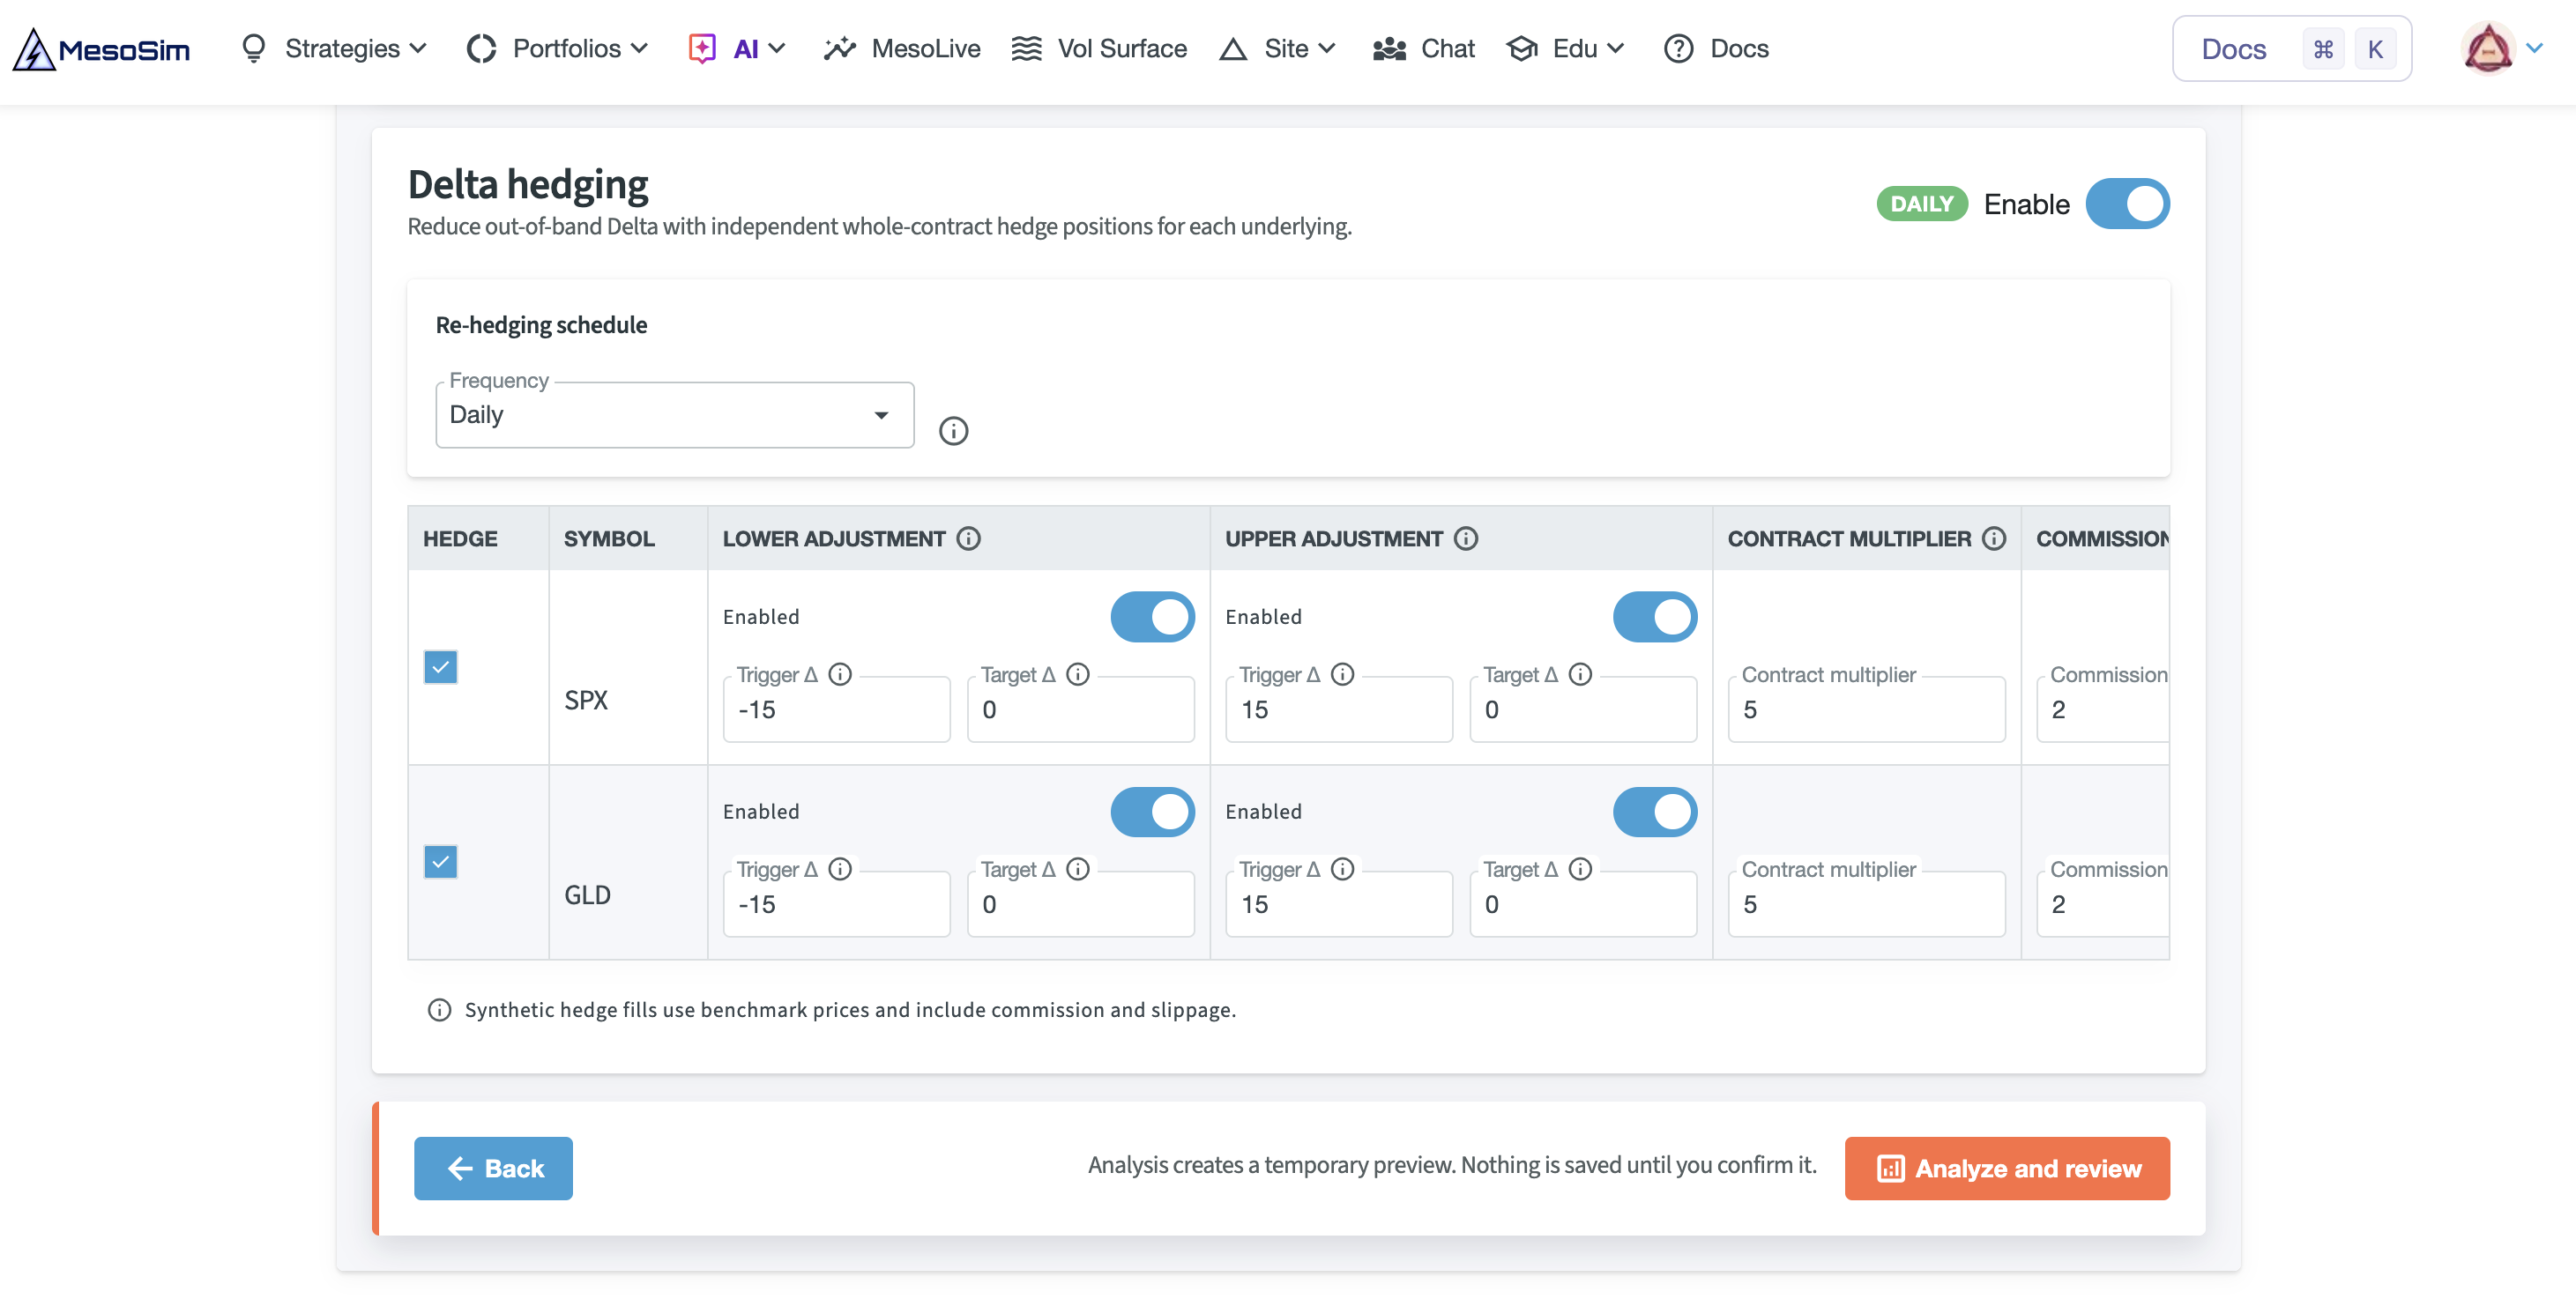
Configure hedge triggers and targets separately for each underlying. Synthetic hedge fills include commission and slippage.
StatSim
StatSim adds Monte Carlo and bootstrap simulations to both individual backtests and portfolios. It generates alternative paths from observed returns using Stationary Bootstrap or Permutation shuffle, so you can compare the historical equity curve and drawdowns with simulated outcomes.
Stationary Bootstrap also includes a positive mean return test that reports a p-value and statistical significance. The result provides evidence under the test's assumptions, but does not by itself rule out overfitting.
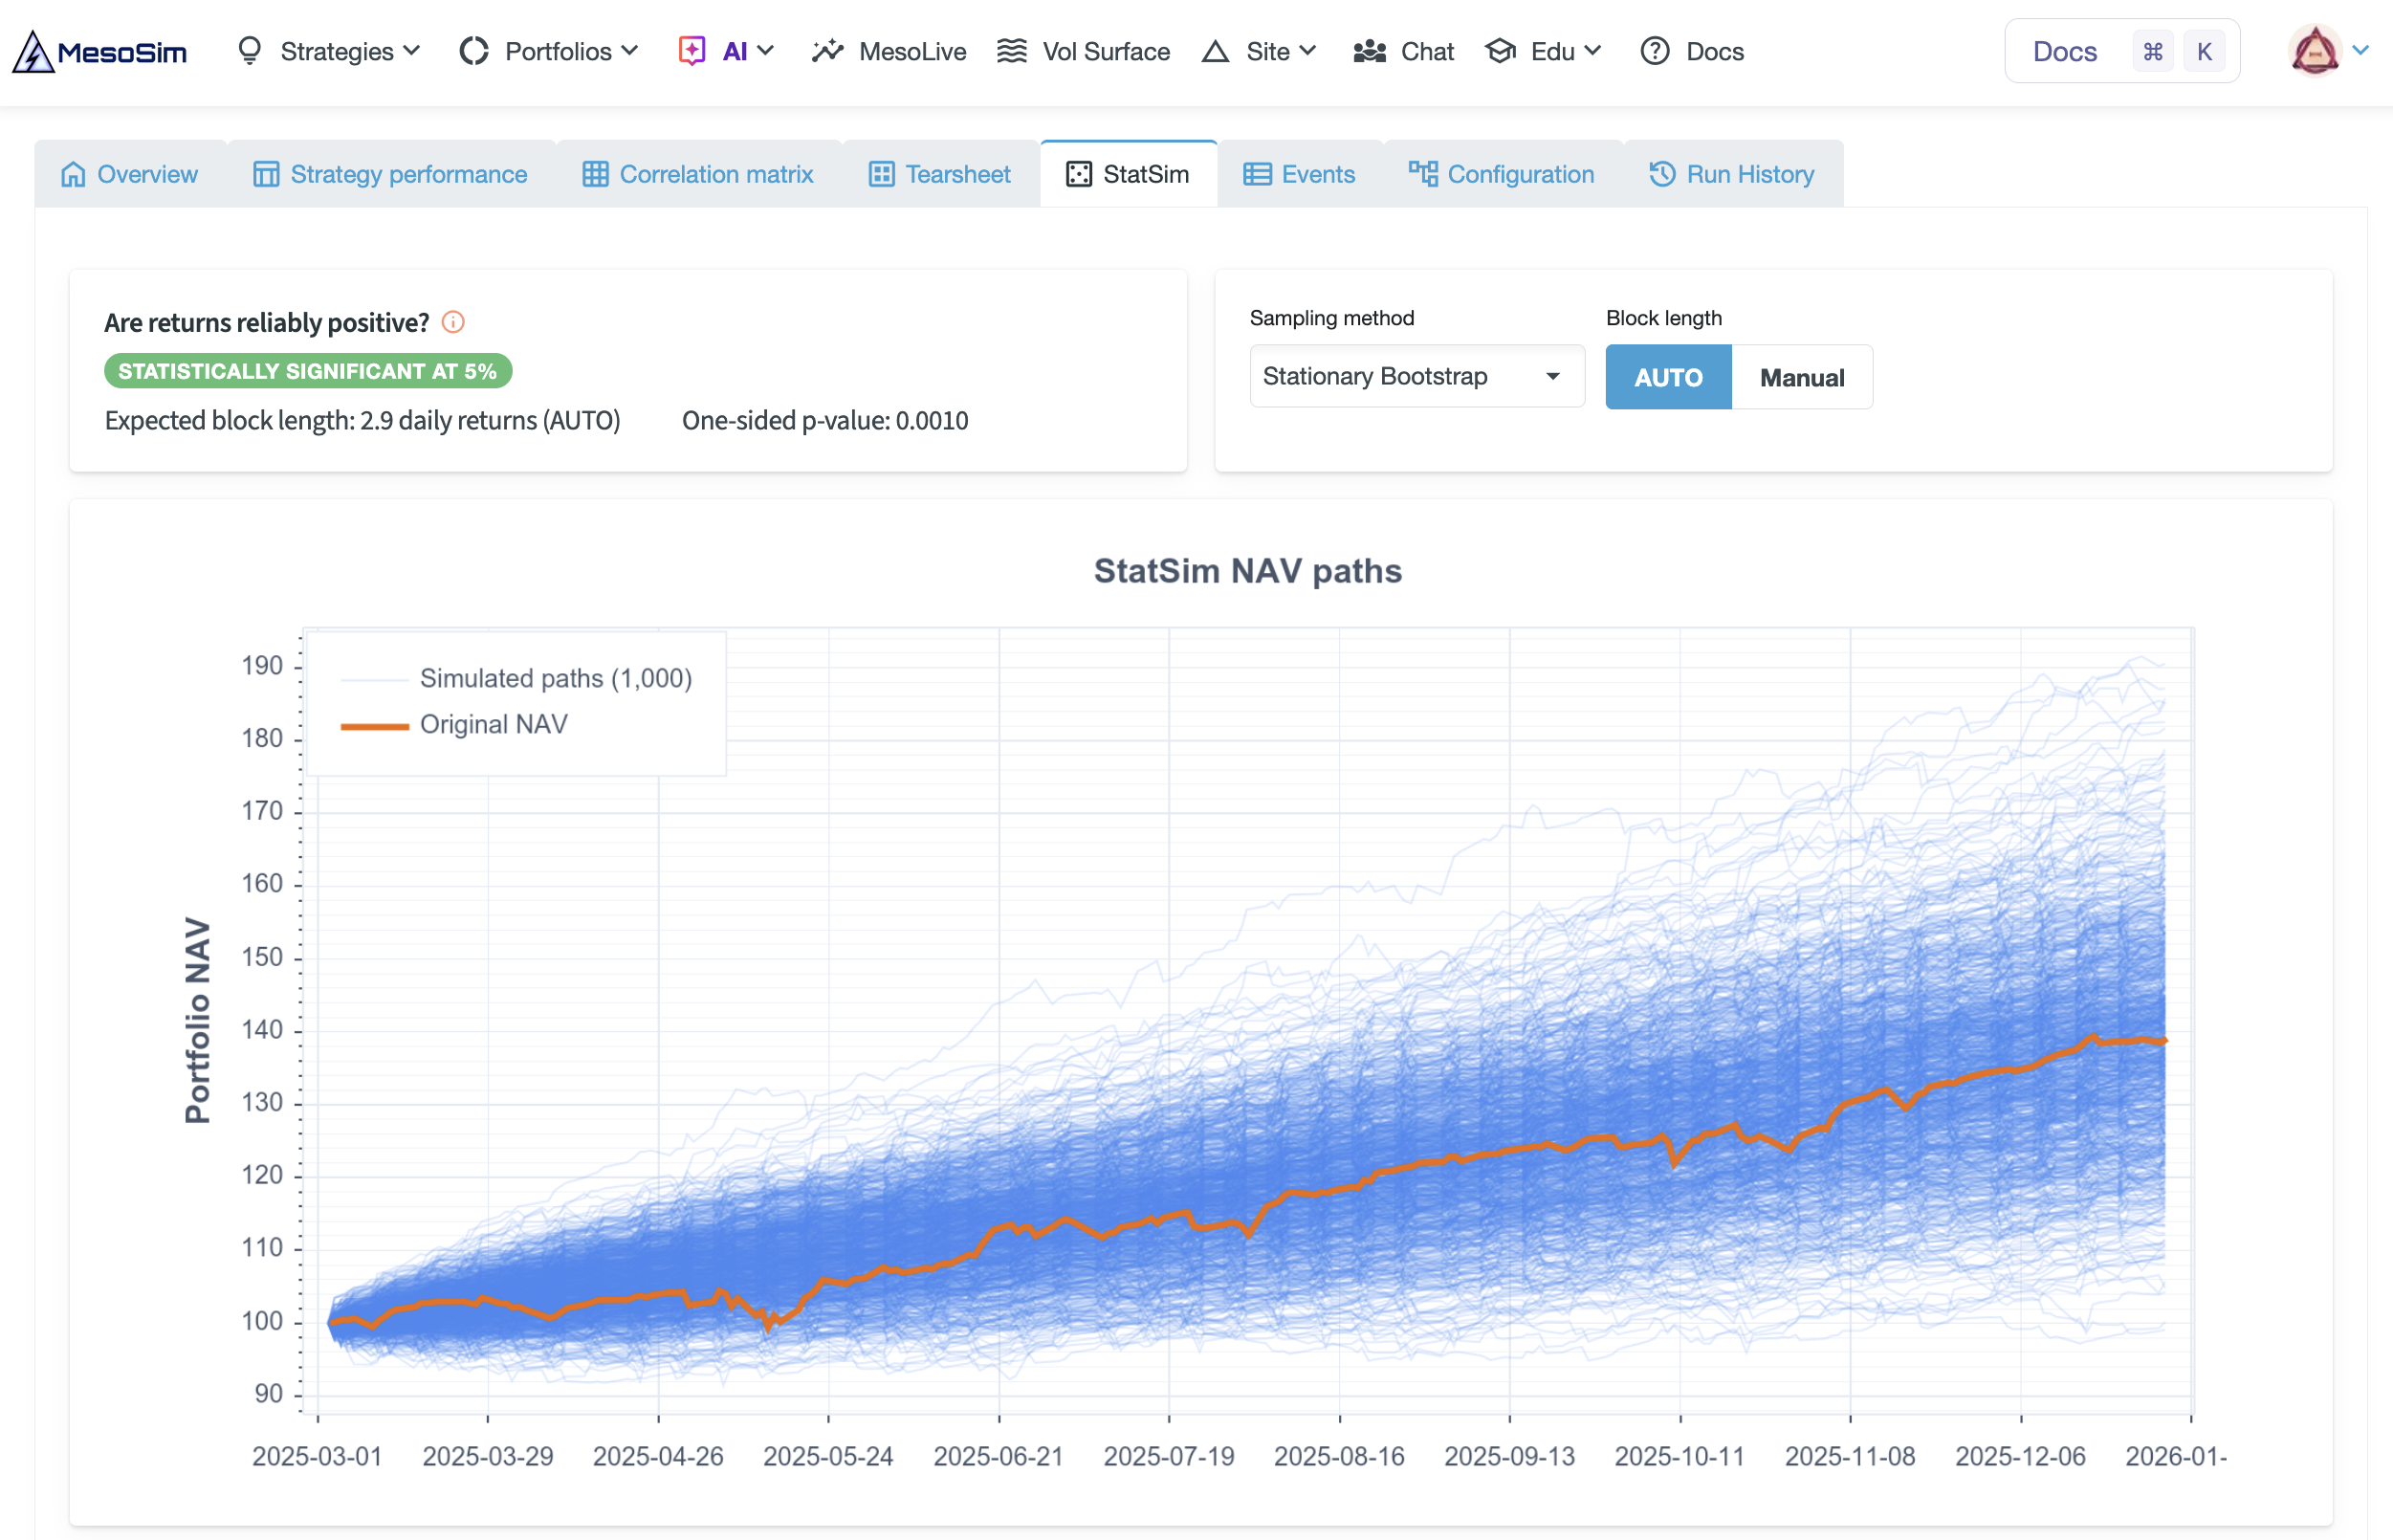
The orange line shows the original portfolio path; blue lines show the resampled paths. The statistical test appears above the chart.
New slippage model
MesoSim v3.2 introduces a new slippage model that lets you model execution costs based on the width of the bid–ask spread. You can make slippage increase as spreads widen, so the modeled cost reflects the quotes available at the time of the order.
We recommend configuring slippage in your backtests, especially when trading options with wider bid–ask spreads, such as in-the-money (ITM) options. This helps you assess whether a strategy's results hold up after allowing for less favorable fills.
Breaking changes
We understand that changes that are not backward compatible are inconvenient, and we try to keep them infrequent. The changes in this release were needed to correct legacy behavior and improve simulation performance.
MesoMetrics
Metrics are an important part of the simulator: they summarize backtest results using common, well-known measures. Until now, we have relied on the QuantStats library to generate statistics and tearsheets.
QuantStats served us well, but its calculation speed became a limiting factor. We addressed this by introducing our own, much faster metrics library, MesoMetrics.
MesoMetrics comes with full documentation and takes over metrics calculation and tearsheet generation from the old library. It adds several new metrics, including the frequently requested Max Drawdown on Initial Capital. It also addresses known issues in QuantStats, including the Kelly criterion calculation and the annualization of some metrics, etc.
The updated tearsheet is faster to generate and presents the metrics in a refreshed layout.
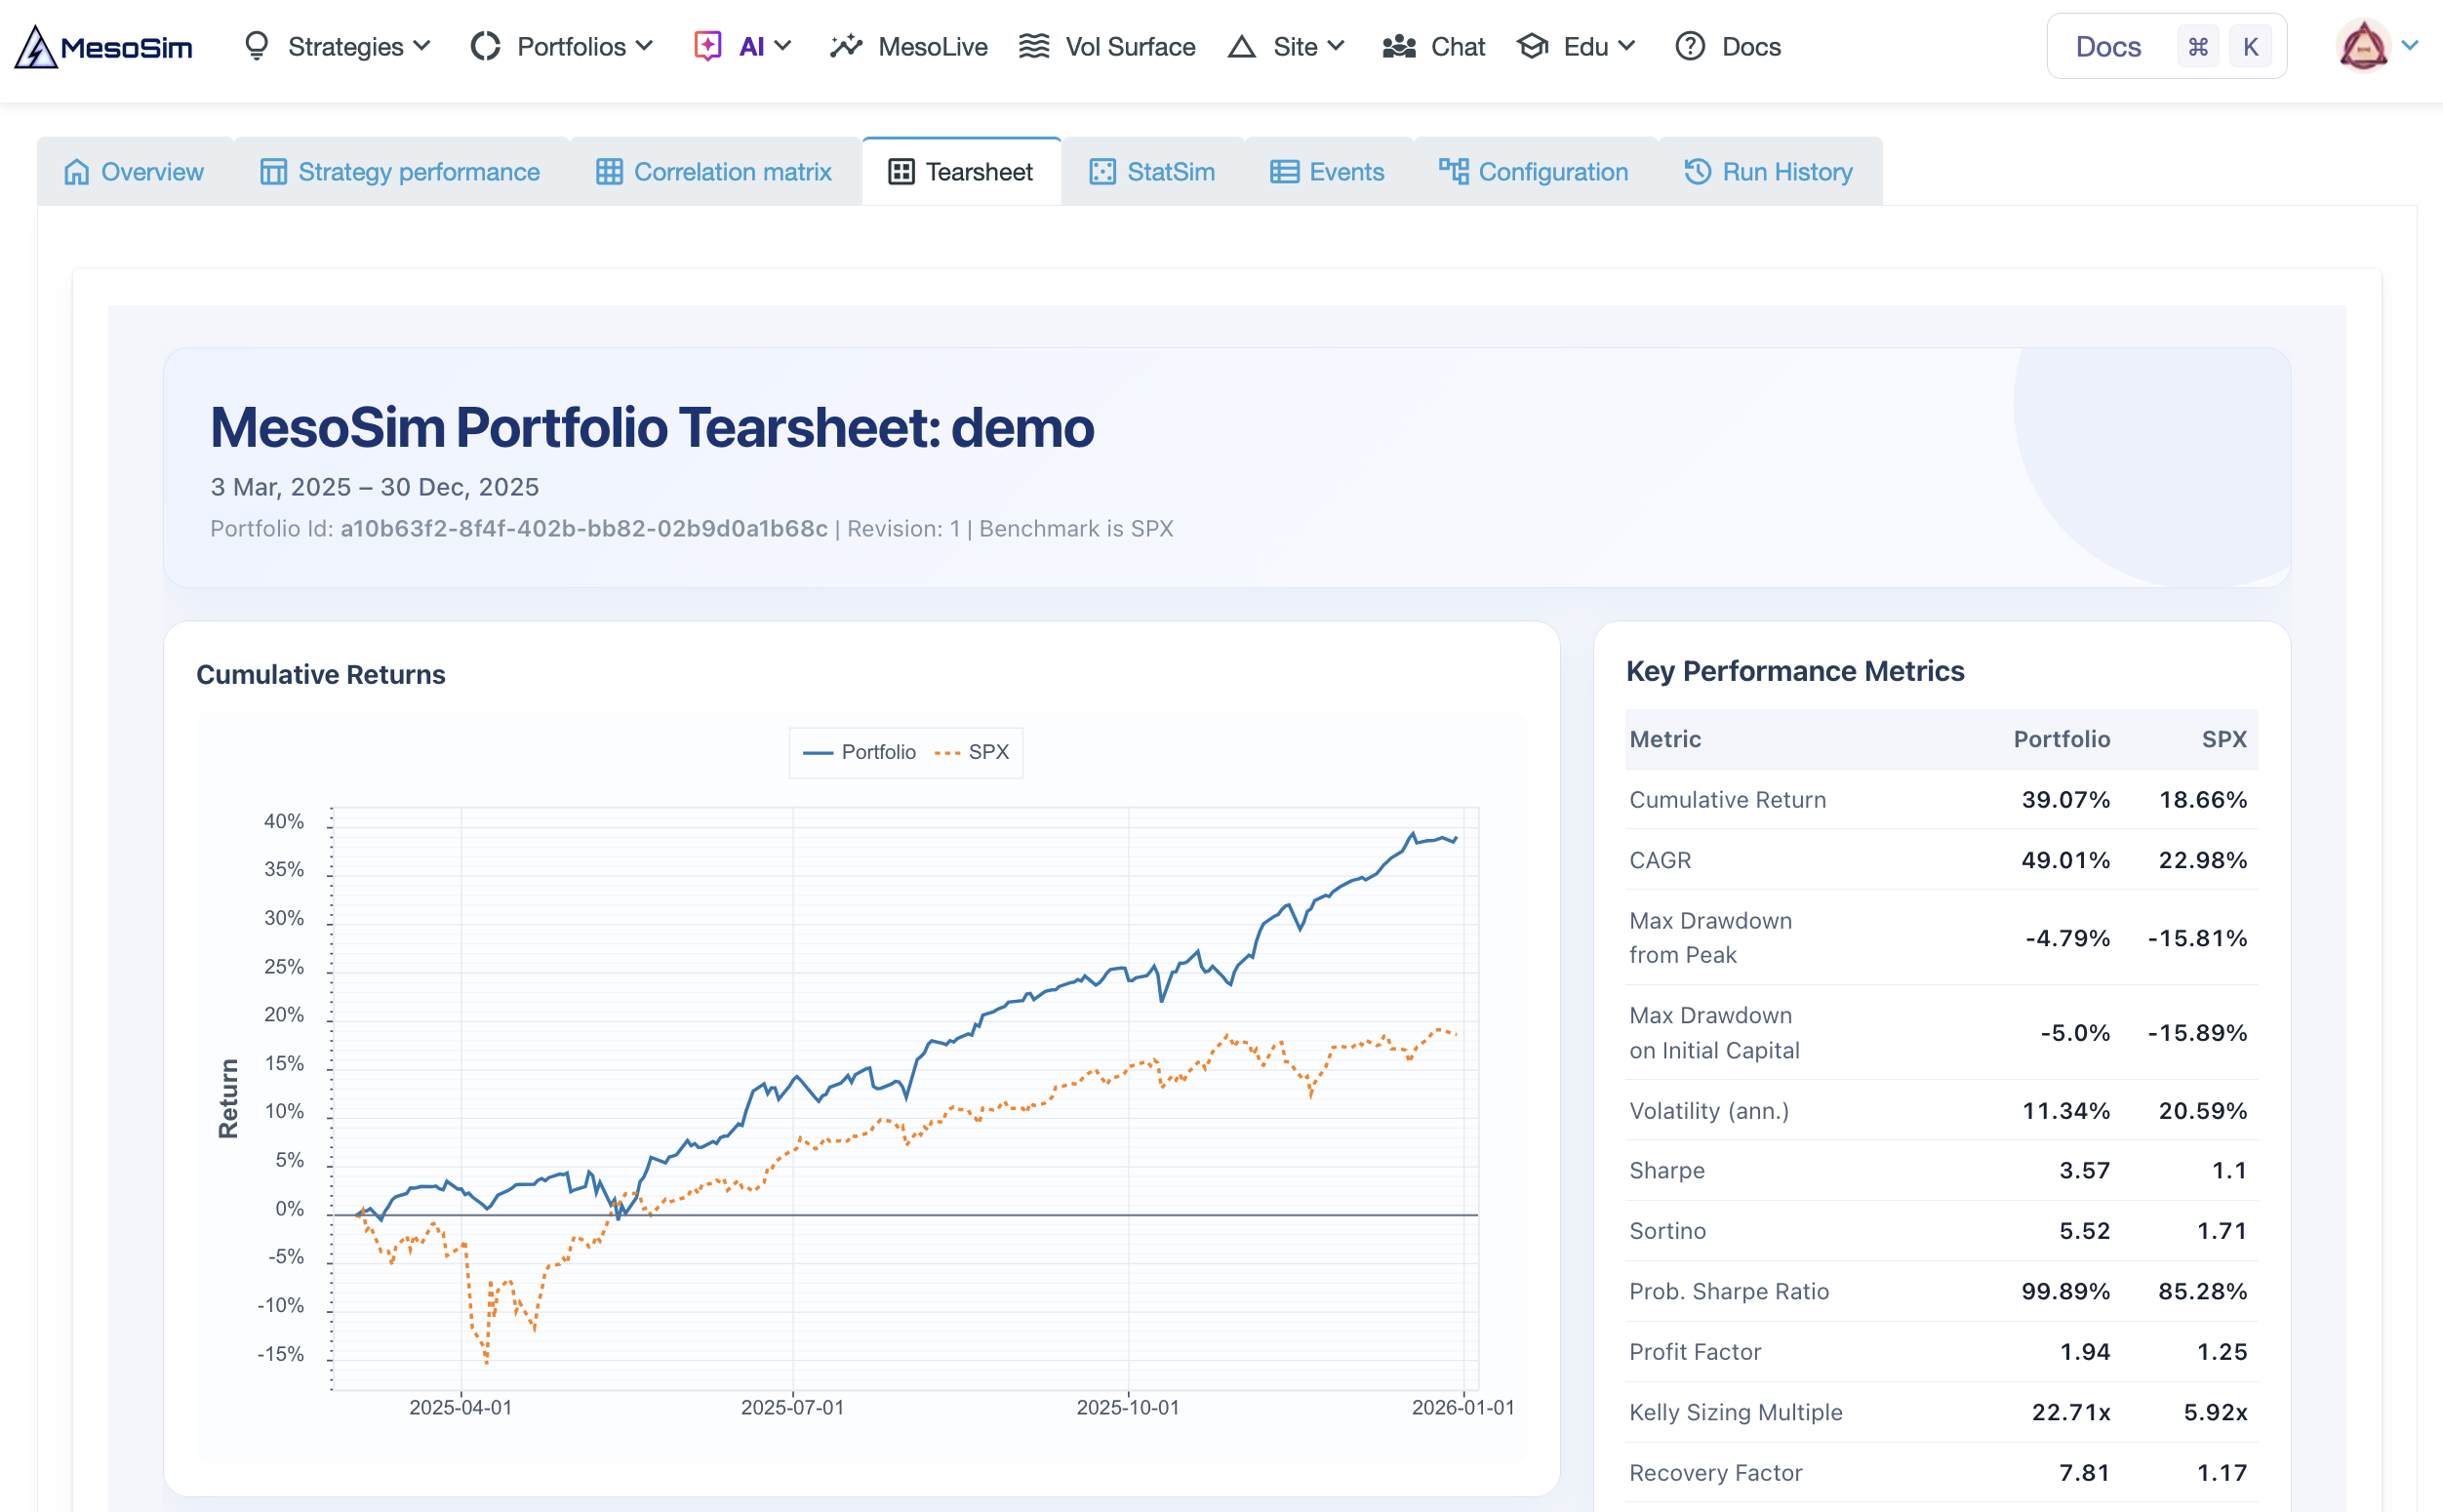
The refreshed tearsheet places cumulative returns beside key metrics, including both drawdown measures.
Existing backtests retain their historical metric definitions; rerun a strategy to obtain results calculated with v3.2.
IV Rank and Percentile
As part of our plan to support one-minute resolution for 0DTE options, we are changing how IV Rank and Percentile are calculated. Until now, we have used all five-minute observations to calculate these indicators. This meant that the reference distribution differed depending on whether intraday or daily data was used.
We are addressing this by using only daily observations for the lookback history. The current IV value is compared with daily IV readings taken near the close over the prior year.
This change can result in slightly different values for IV Rank (underlying_iv_rank) and Percentile (underlying_iv_pct).
Please rerun your backtests to use the updated calculations.
The new calculation also brings MesoLive's IV Rank and Percentile values closer to those reported by brokerages.
Bounded intraday schedules
Entry, adjustment, and exit schedules can now restrict intraday checks to a window relative to market open and close. For example, a strategy can check for entries every five minutes, starting ten minutes after open and stopping an hour before close.
Previously, intraday schedules such as Schedule.Every set to 5min or 15min covered the full trading session.
Intraday schedules now enforce AfterMarketOpenMinutes and BeforeMarketCloseMinutes when set.
To retain the previous full-session behavior, set both fields to null.
Performance improvements
MesoSim v3.2 runs 20–30% faster on daily timeframes, with a 1.5–5x speedup on intraday timeframes (1, 5, and 30 minutes), depending on the strategy and workload. These improvements reduce the time spent waiting for portfolio runs and repeated research experiments.
Closing thoughts
With this release, we take a major step toward agentic research. MesoSim combines flexible options simulation with direct access for AI agents.
Development continues. We are actively working on adding one-minute data for 0DTE options and expanding FundPro's capabilities to accelerate trade discovery.