The Super Bull Trade and its Relaxed Variant
John Locke (@Locke4Success) is a reputable source when it comes to Options Trading Strategies. You can find many of his trading strategies on YouTube, for free.
His strategies and their variants are often simulated with MesoSim.
We are now adding his Super Bull strategy as a featured trade to our strategy library.
The rules were constructed as discussed in his youtube videos.
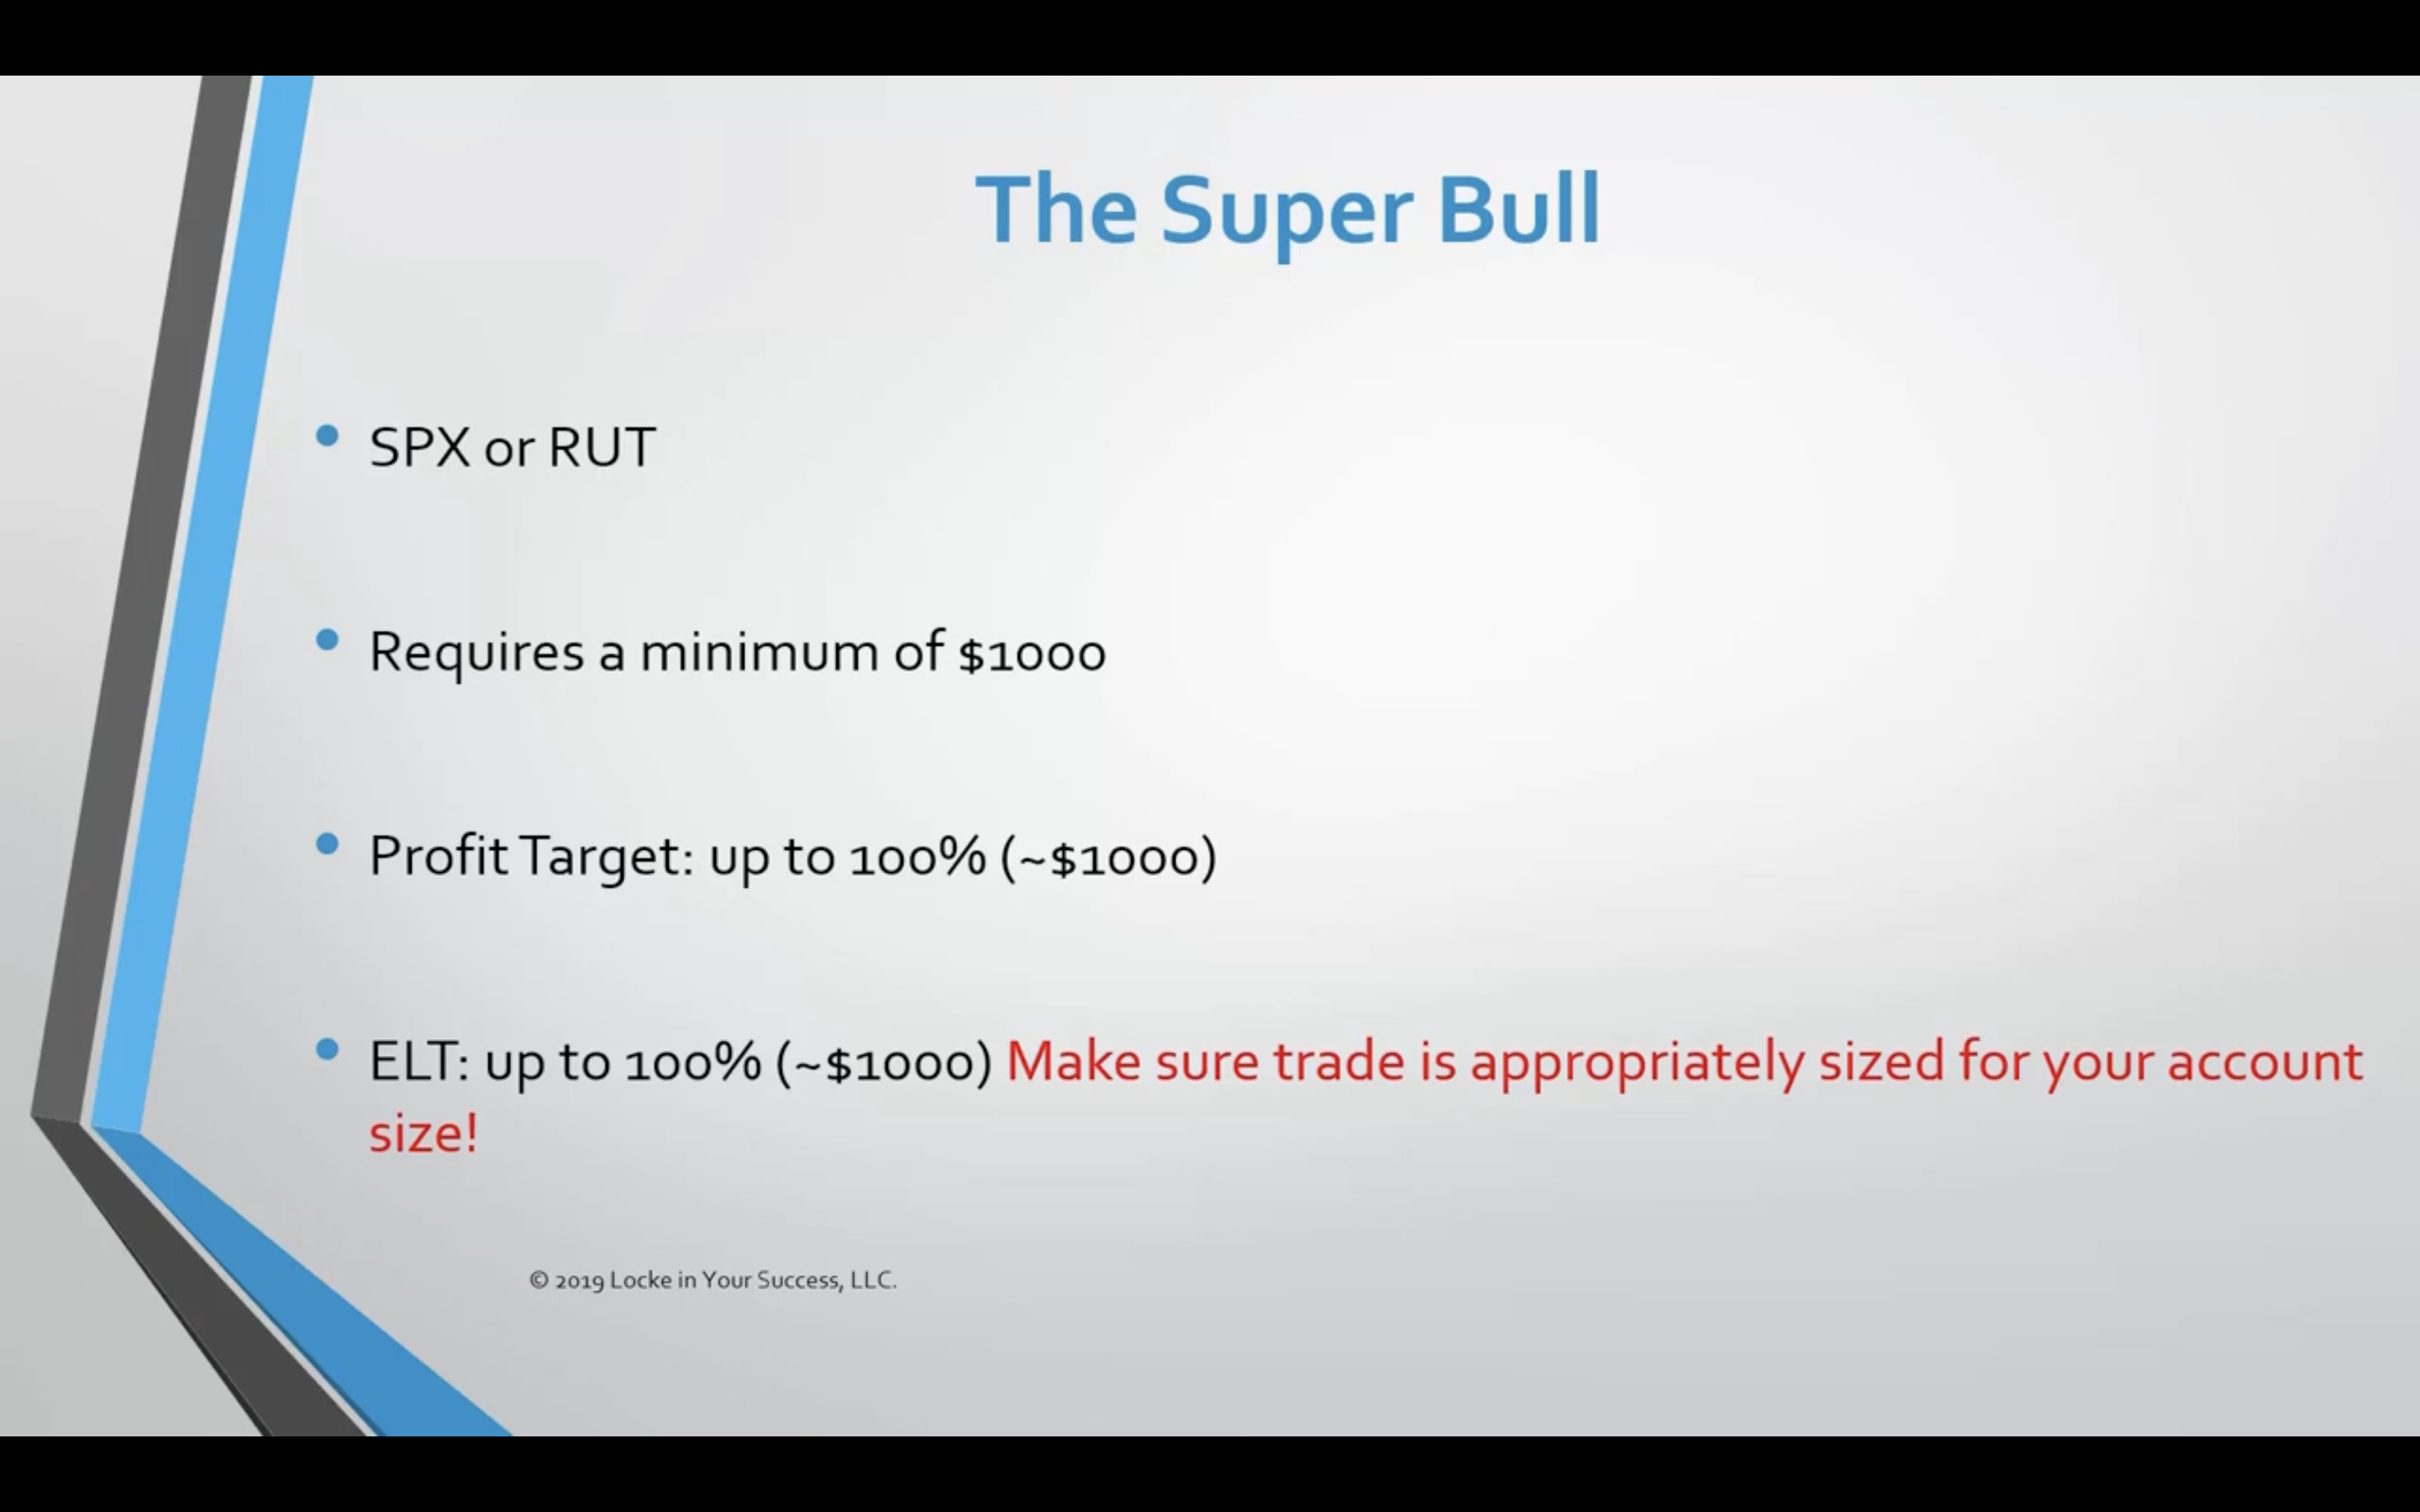
Structure
SuperBull is a Bullish Call Vertical Spread that is initiated precisely at 65 DTE.
Vertical spreads are characterized by defined risk and limited upside potential.
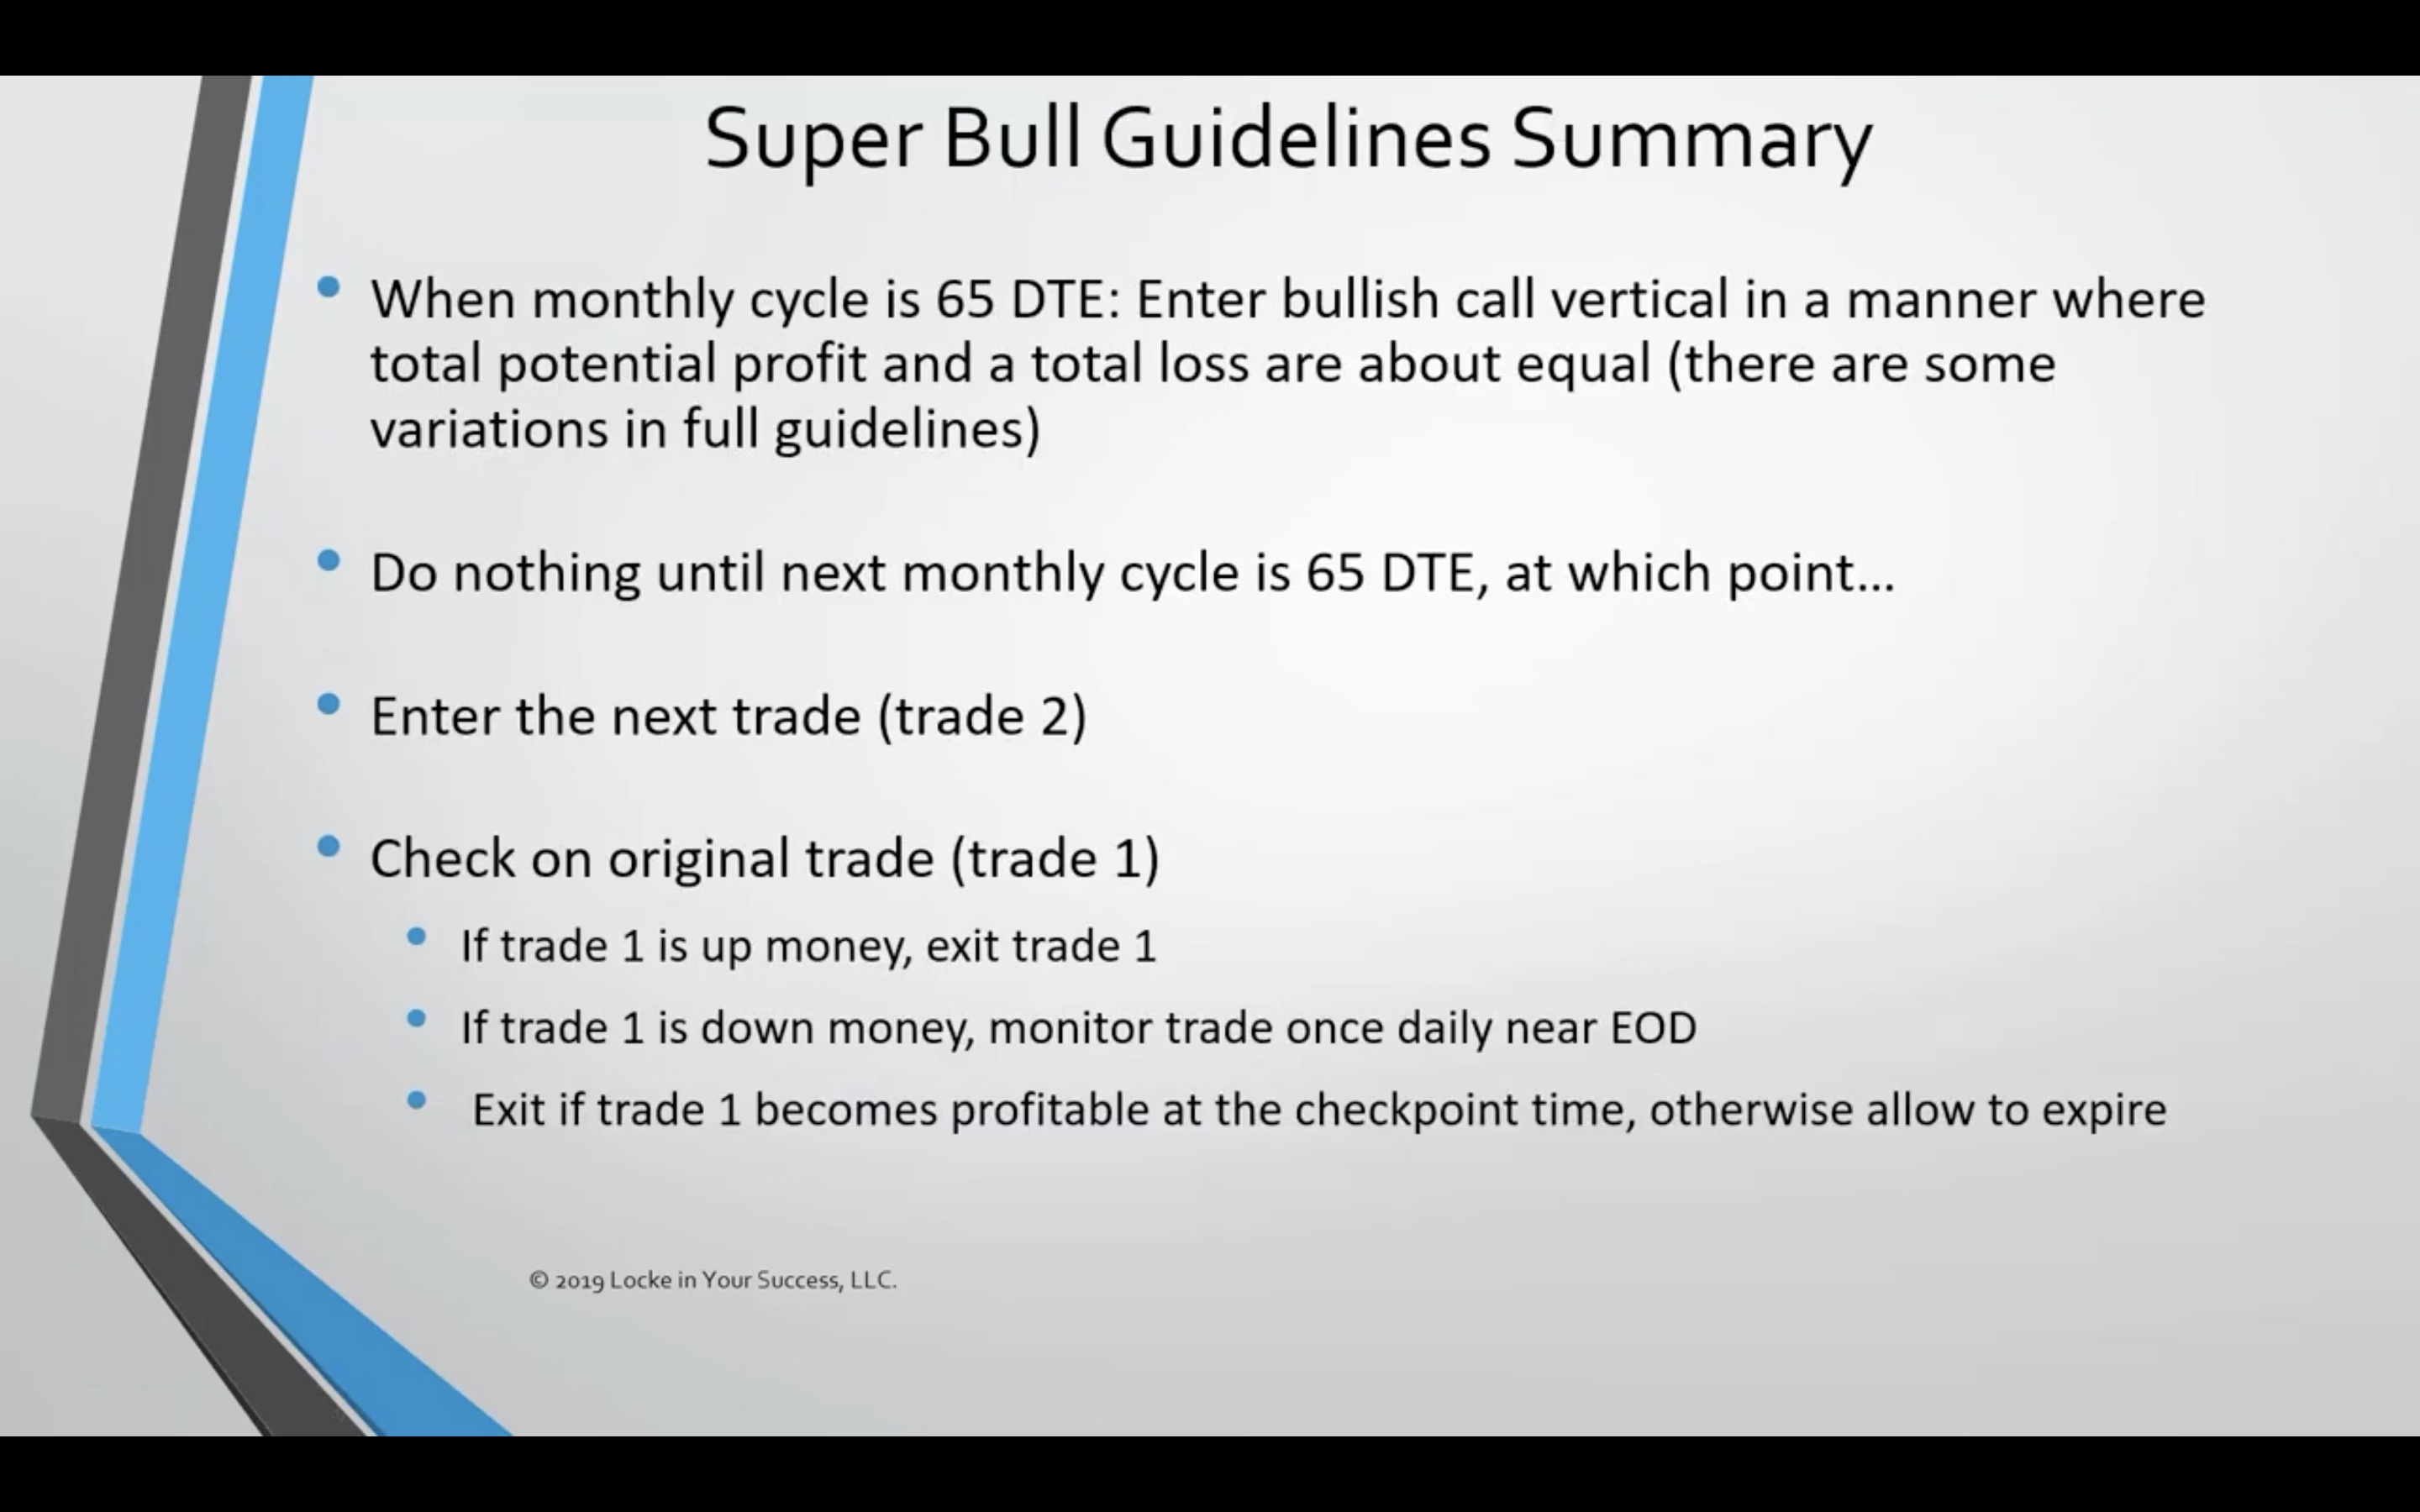
Rules
The rules are summarized in the two screenshots and explained in the video in the Guidelines section.
Entry
Timing and expirations
The trade is entered exactly at 65 Days To Expiration, utilizing the generic monthly expiration cycles:
"Expirations": [ {
    	"Name": "exp1",
    	"DTE": "65",
    	"Min": 65,
    	"Max": 65,
    	"Roots": {
          	"Include": [ "SPX” ]
    	}
  }
]
Strike Selection
The strikes are selected in a manner where the long legs are positioned 20 points above the current price of the underlying asset and the shorts are chosen to achieve a Risk/Reward ratio that is close to 1.0
To construct the spread we are using MesoSim’s Complex StrikeSelector feature.
Long Call
The strike closest to 20 points above the underlying price can be determined by setting the Complex StrikeSelector’s Target to underlying_price + 20 and specifying the constraint to ensure that the chosen leg’s strike will be always above the underlying price. This constraint is necessary because the Selector selects the nearest contract to our target, which - in some cases - may be below the underlying price.
The Statement field of the selector is evaluated for each contract and represents the strike. According to the SuperBull rules, our target will be 20 points above the current underlying price.
{
    "Name": "long",
    "Qty": "1",
    "ExpirationName": "exp1",
    "StrikeSelector": {
      	"Complex": {
        	"Statement": "leg_long_strike",
        	"Target": "underlying_price + 20",
        	"Constraint": "leg_long_strike > underlying_price"
      	}
    },
    "OptionType": "Call"
}
Short Call
Our objective is to choose the short leg in a way that the Risk/Reward ratio of the spread is close to 1.
Risk/Reward ratio can be calculated:risk_reward=Entry Debit / Max Profit
WhereEntry Debit (maximum loss) = Long Leg’s Price - Short Leg’s Price
Max Profit = Short Leg’s Strike - Long Leg’s Strike - Entry Debit
This calculation can be defined as:
"Complex": {
	"Statement": "(leg_long_price * leg_long_qty + leg_short_price * leg_short_qty) / ((leg_short_strike - leg_long_strike) * leg_long_qty - (leg_long_price * leg_long_qty + leg_short_price * leg_short_qty))",
	"Target": "1",
	"Constraint": "leg_short_strike > leg_long_strike"
}
About the Risk/Reward ratio
While John suggests aiming for a 1:1 Risk/Reward ratio, he shows multiple examples where the trade is initiated with a ratio lower than that. He explains that this is due to the unusual volatility skew observed on those particular days. In such trades, the risk/reward ratio was around 1.5 at the initiation.
Sizing
John suggests that the trade should be sized so that it risks a maximum of 10% of the account size. This rule was implemented in our run using Entry.AbortConditions:
We abort the entry if the Entry Debit would be greater than 10% of our NAV.
In our initial attempts, we used one contract for each leg. This turned out to be inadequate: Most of the time we under-sized the position (Maximum Risk was around 1% of NAV). To alleviate this problem we introduced Entry.QtyMultiplier to MesoSim, which is capable of scaling all the legs, once they are identified. We leverage this feature to target a maximum loss of 10% (in terms of account size) for our trades.
Exit
The exit rules for the strategy can be summarized as follows:
When the next monthly expiration becomes 65 days away, we enter a second trade. From that point onwards, we monitor the progress of the first trade. If the first generates a positive return, we exit the trade. However, if the first trade is at a loss we wait until it becomes profitable or reaches expiration.
These rules in MesoSim can be expressed as:
"Exit": {
	"Schedule": {
      	"BeforeMarketCloseMinutes": 30,
  	    "Every": "day"
	},
	"Conditions": [
  	     "(pos_in_flight > 1) and (days_in_trade > 28) and (pos_pnl > 0)"
	]
  }
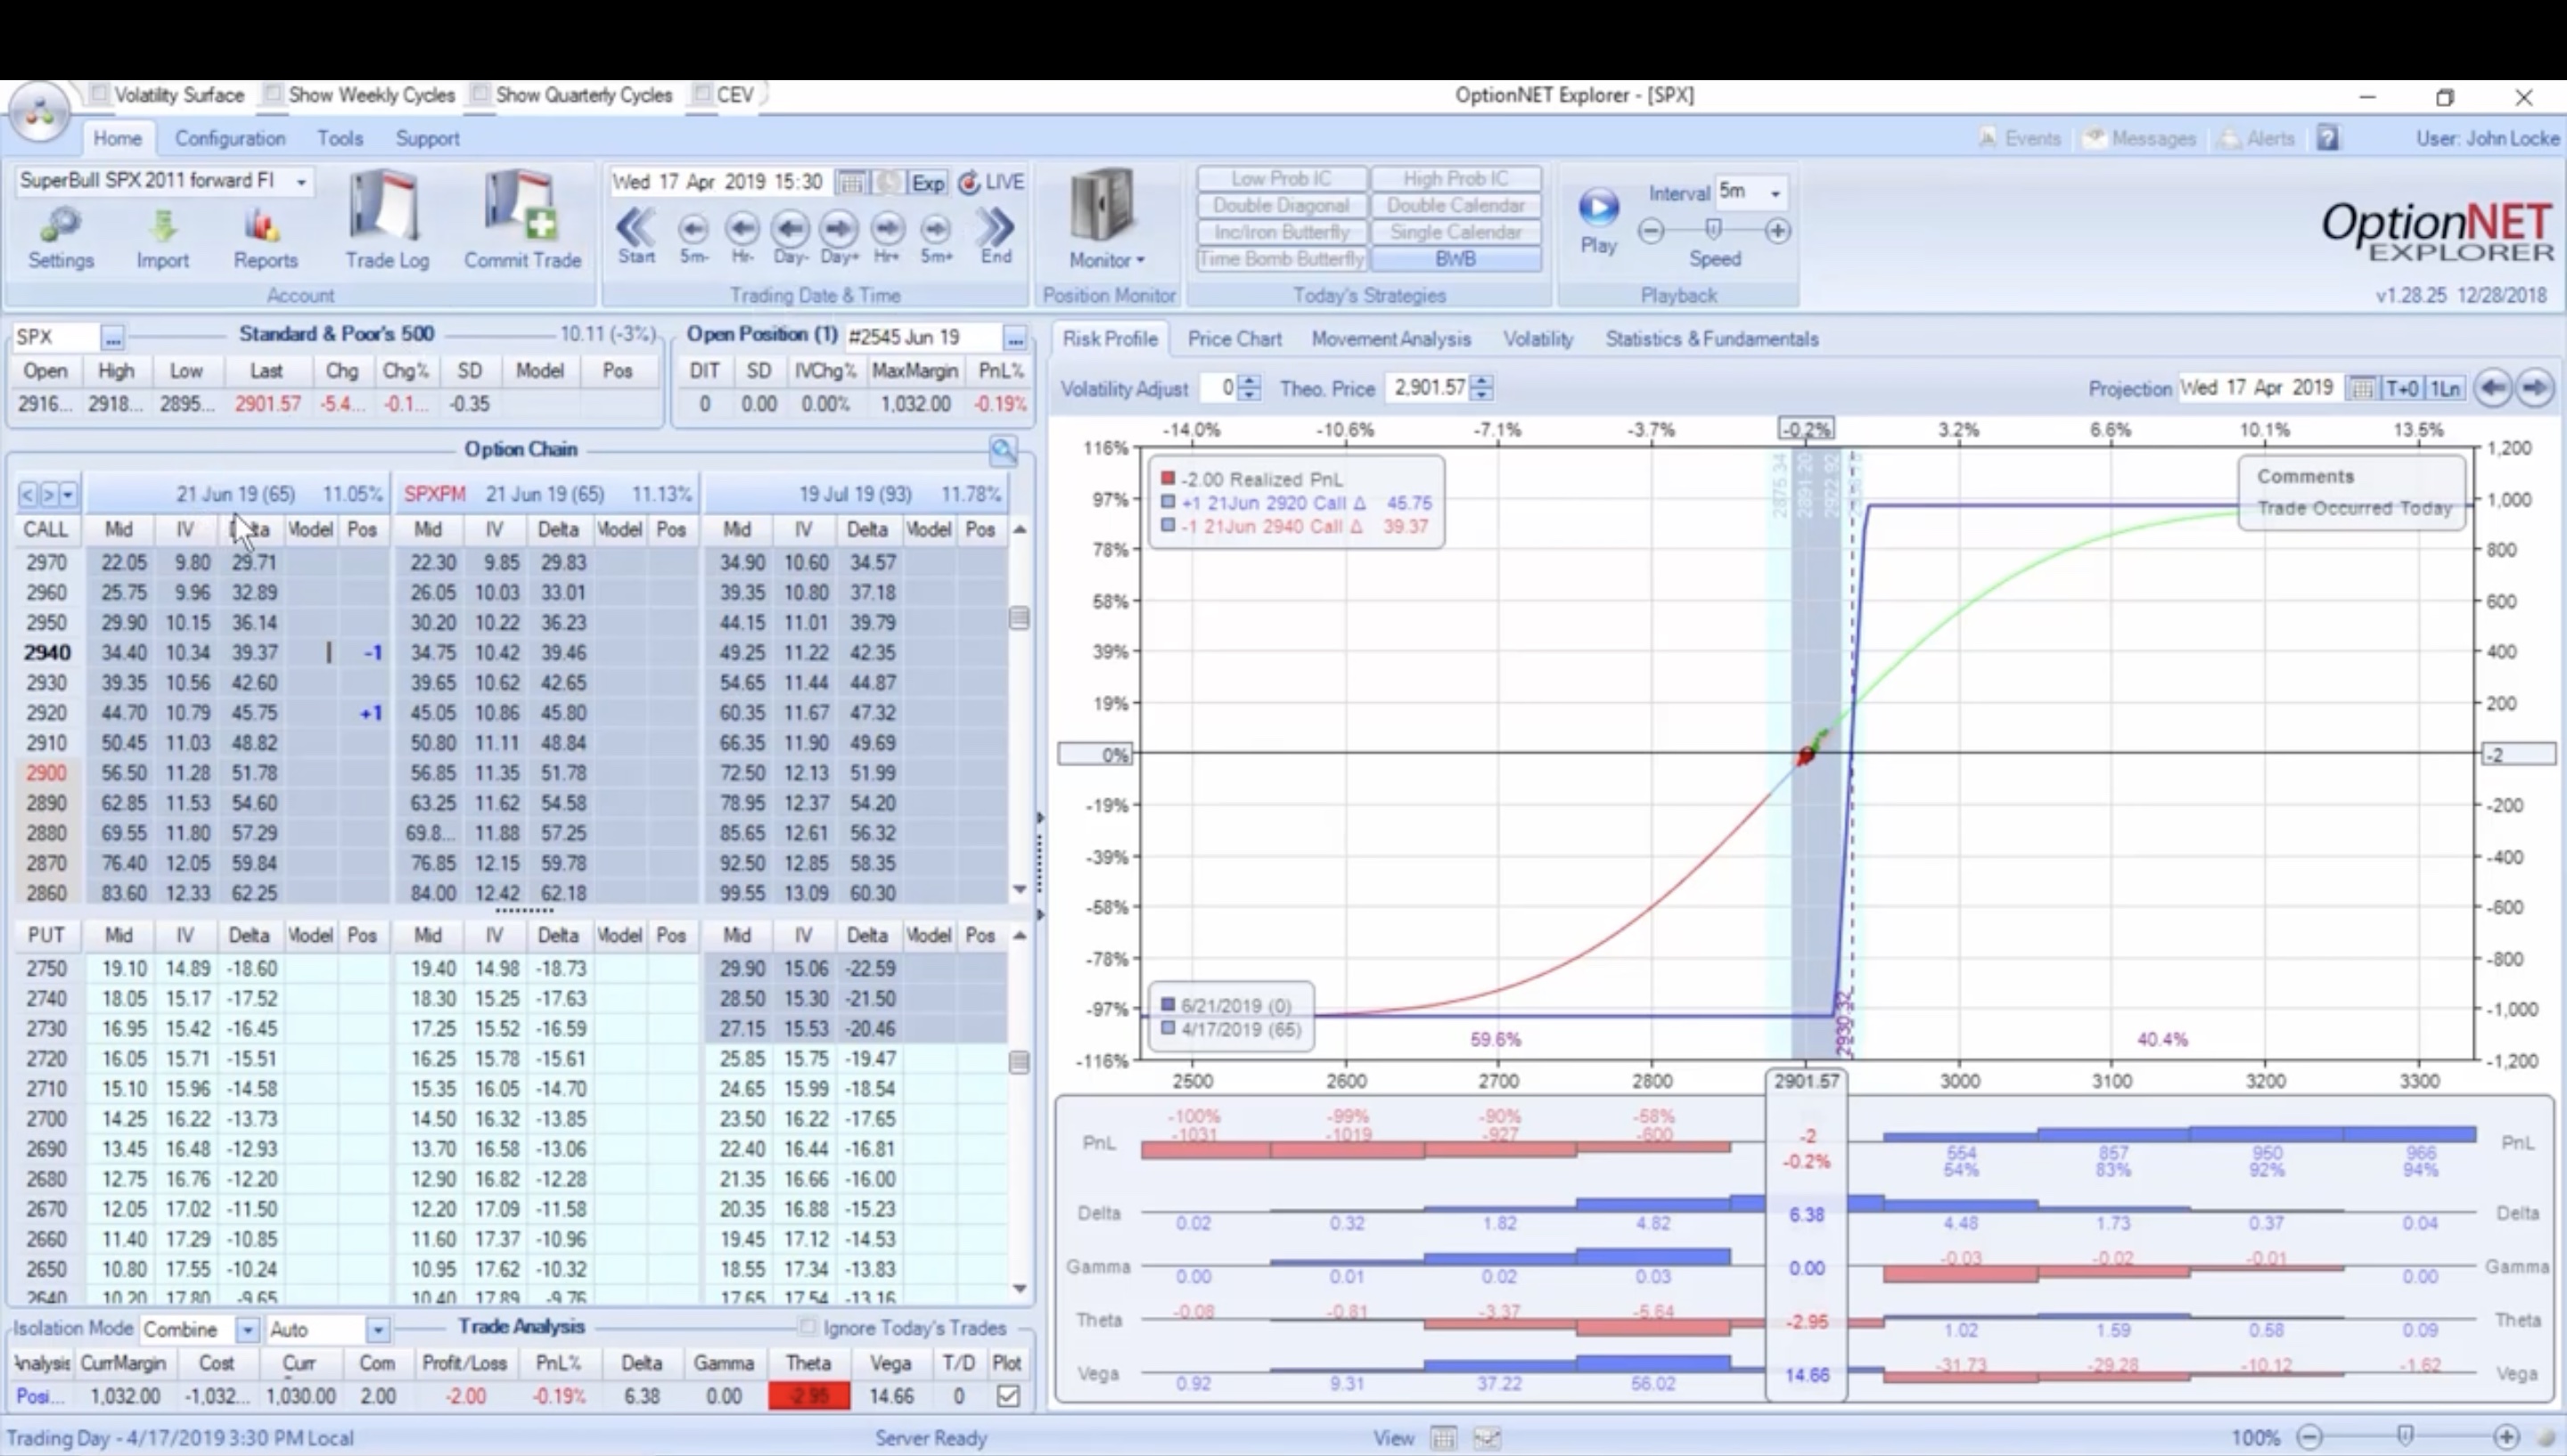
OptionNet Explorer accuracy
OptionNet Explorer is frequently utilized by options traders for modeling and manually simulating trades. It is essential to comprehend the accuracy and limitations of its simulation and real trading accuracy before engaging in trading activities. This section provides concise insights into these limitations, allowing the reader to better understand the comparison between MesoSim and OptionNet simulated results.
Backtest result resolution
ONE displays the strategy’s summary PnL chart using only the realized dollar amounts.
This represents the lowest resolution possible for backtesting as it lacks information about drawdowns experienced during the trades.
Furthermore, common financial metrics, like CAGR (Compound Annual Growth Rate), Max Drawdown, and Sharpe Ratio are absent from ONE’s report.
Live Trading accuracy
OptionNet Explorer can be utilized for initiating and monitoring live trades. However, there is one potential accuracy issue to be aware of. When entering complex (multi-legged) trades using the compounded Option Price, the individual leg prices in OptionNet often differ from the actual fills. Therefore, it is necessary to manually adjust the prices of the individual legs after entering the trade. This adjustment can be performed using the Trade Log window.
Lack of benchmark
OptionNet Explorer does not have the feature of comparing strategies to other strategies or benchmarks, such as the S&P-500 (^SPX).
Without reference points, it becomes challenging to determine whether the strategy “beat the market” or not.
Compared to MesoSim
In contrast, MesoSim’s performance reporting tracks daily NAV values and computes quantitative performance metrics for both the strategy and the benchmark, such as Sharpe, Sortino, Omega, and more.
This information provides a more precise representation of the strategy’s performance, allowing the user to better understand its expected performance.
Please note that we do not mean to suggest that MesoSim is better than OptionNet. Instead, we state that OptionNet's functionality can be extended by MesoSim's automated backtesting and performance reporting capabilities.
In other words:
MesoSim is a companion service to OptionNet Explorer.
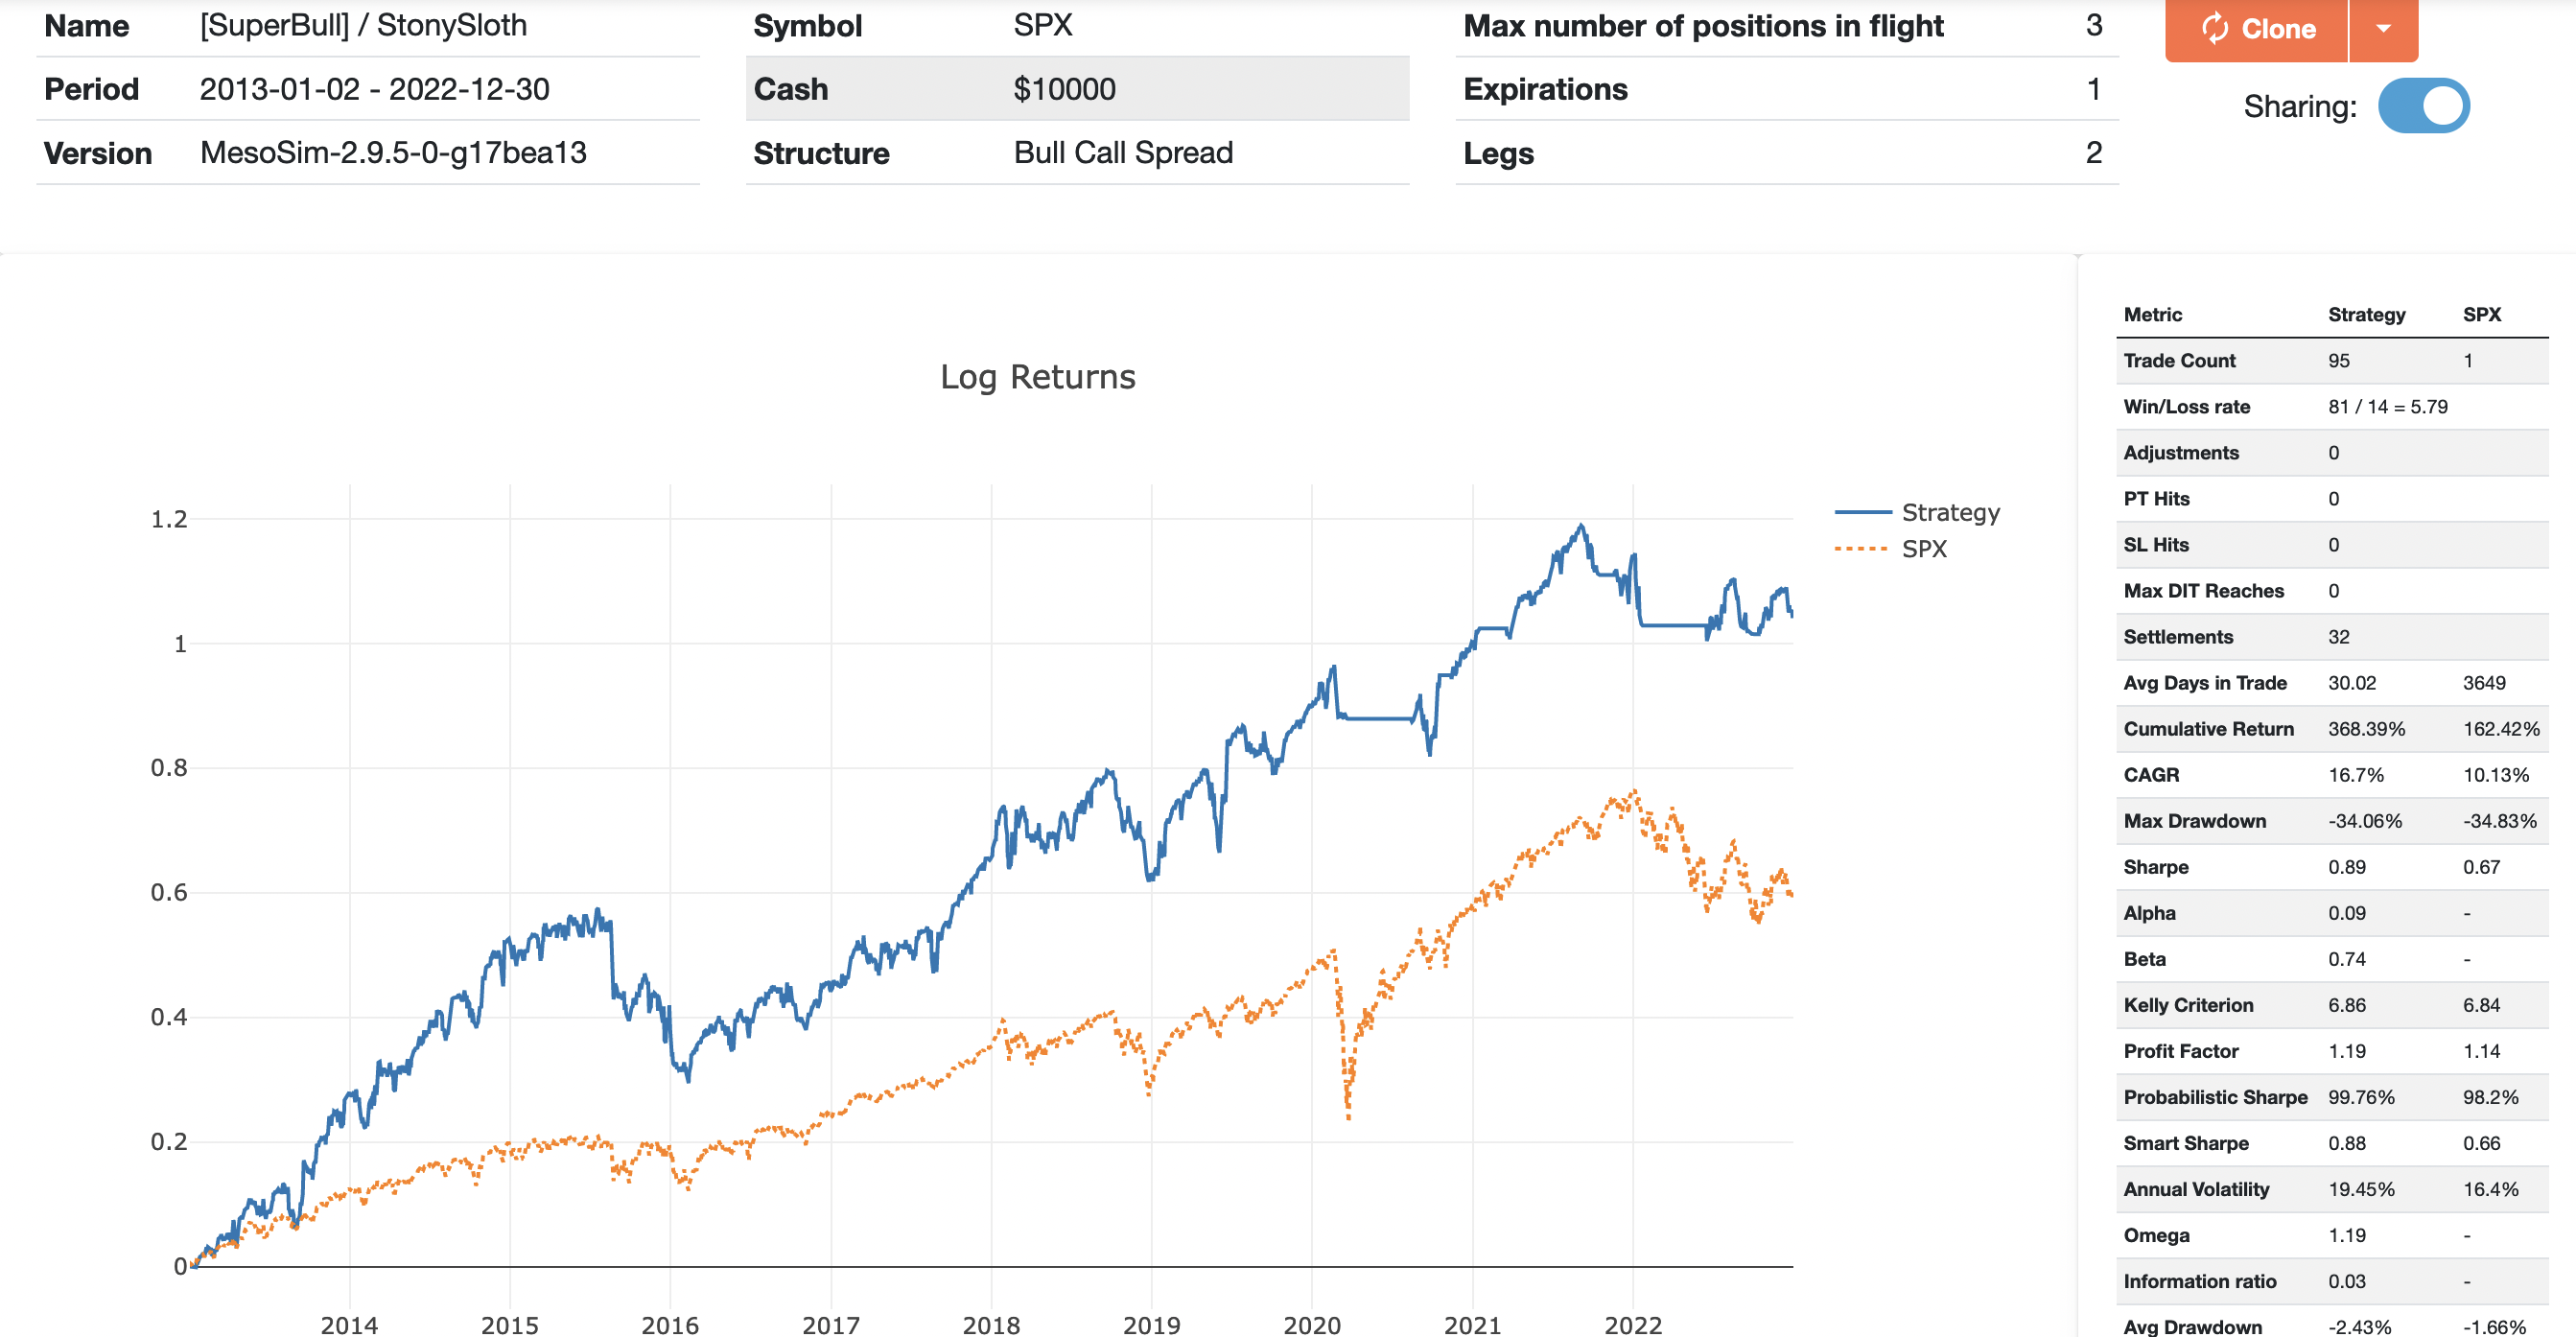
SuperBull Results
We’ll be using the 2013 - 2023 time period to assess the strategy performance under various market conditions.
Overview
You can access the associated MesoSim run here:
https://portal.deltaray.io/backtests/45d26d23-6e7f-4655-9893-be15f29ea140
Analysis
Our win rate of 85.2% (81/95) confirms that we are close to what John achieves (86%) with this trade.
Both the Log Return and yearly breakdown charts show that the trade performs well during Bull Markets, such as 2013-2014, 2019, and 2021. However, it exhibits higher volatility during sideways markets.
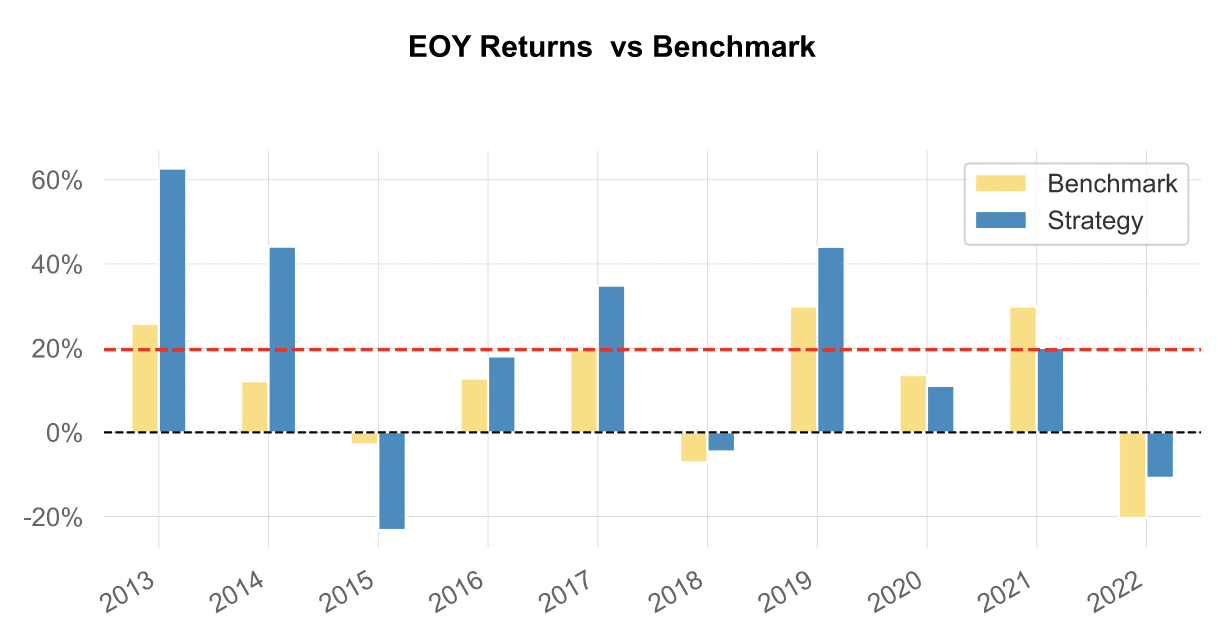
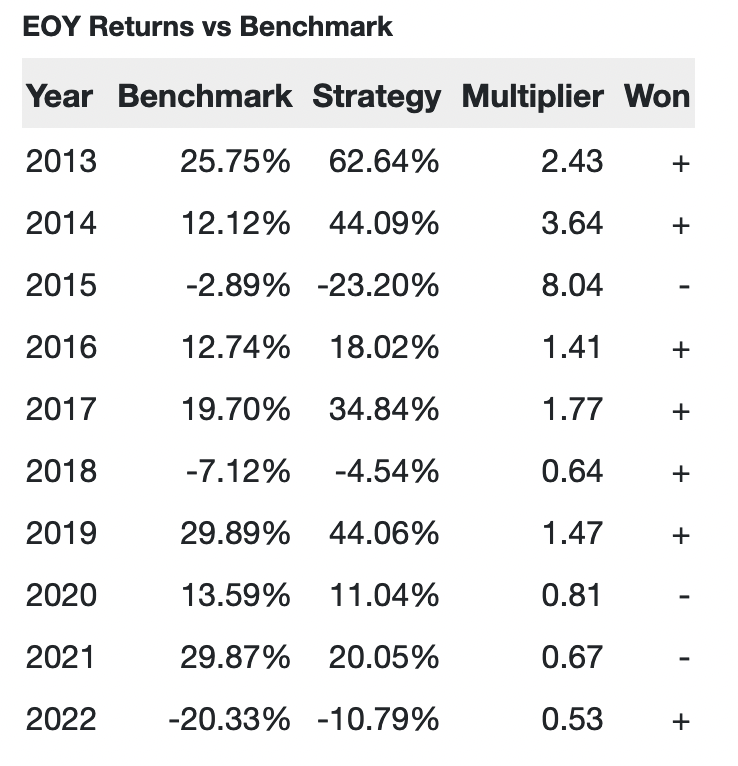
If we compare SuperBull with the S&P-500 Buy and Hold strategy we can conclude that it performs better in the validation period:
- Higher CAGR: 16.7% vs 10.11%
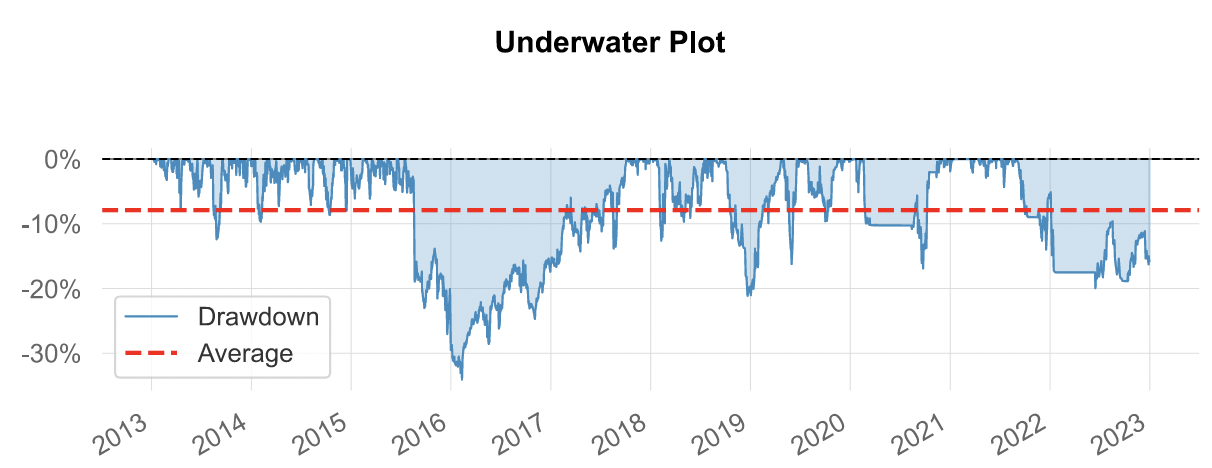
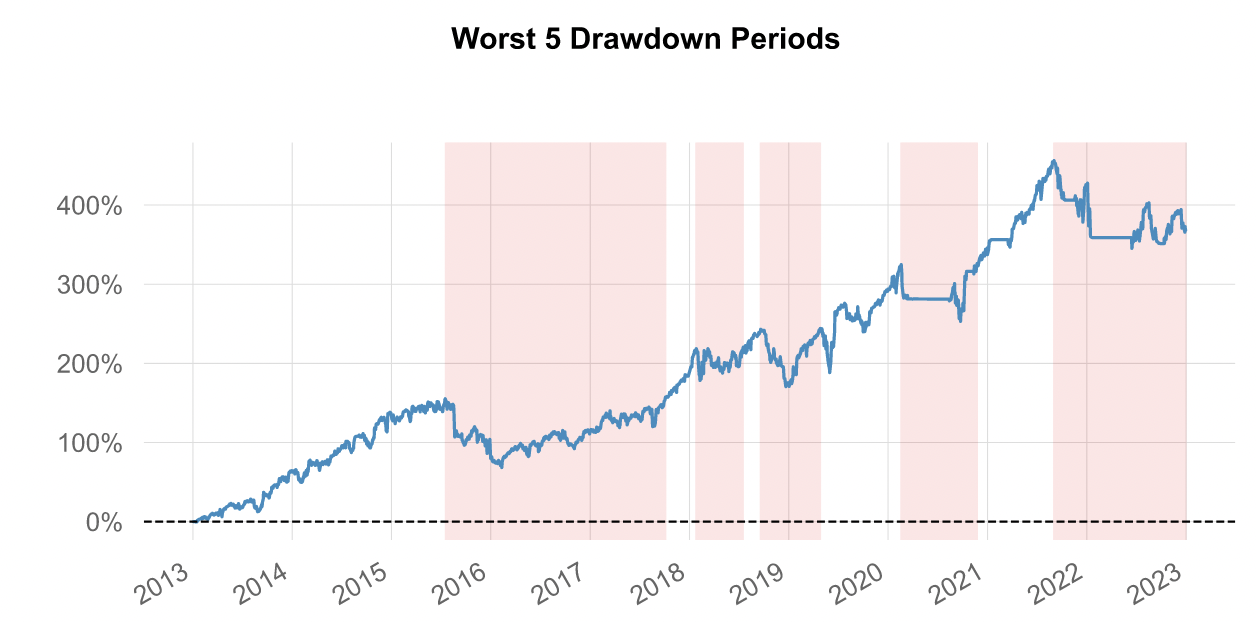
- Slightly lower max drawdown: -34.06% vs -34.83%
- Improved Sharpe ratio 0.89 vs 0.67
- It has low margin requirements
Surprisingly, this strategy didn't exhibit a large drawdown during COVID as the Maximum Loss based Entry Filter prevented it from entering during market turmoil.
The Relaxed SuperBull
Rafael Munhoz, a key contributor to our community has thoroughly analyzed this trade and developed his own variant. Based on his experience, it proved challenging to find optimal trades that offered a 1:1 risk/reward ratio. He made adjustments to the trade to address these challenges and generously shared his results with us.
Entry Differences
The original trade targets verticals using the 1:1 risk/reward ratio exactly at 65DTE.
Rafael made a decision to relax these rules:
- Consider trades between 65 to 75 DTE, targeting 60
- Allow for an expanded range of risk/reward values using the inverted metric:
reward/risk >= 0.7 - Define the Call Debit spread using ATM Delta=48 and Debit price of $500
- Enable up to 10 positions in flight
- Trade -2x2 contracts in each position
Exit Improvements
The original exit rules are substituted with the following, more conventional, triple barrier type of exit strategy:
- Profit Target: 50% of max profit (entry debit)
- Stop Loss: 200% of max profit
- Max Days In Trade: 60
Results
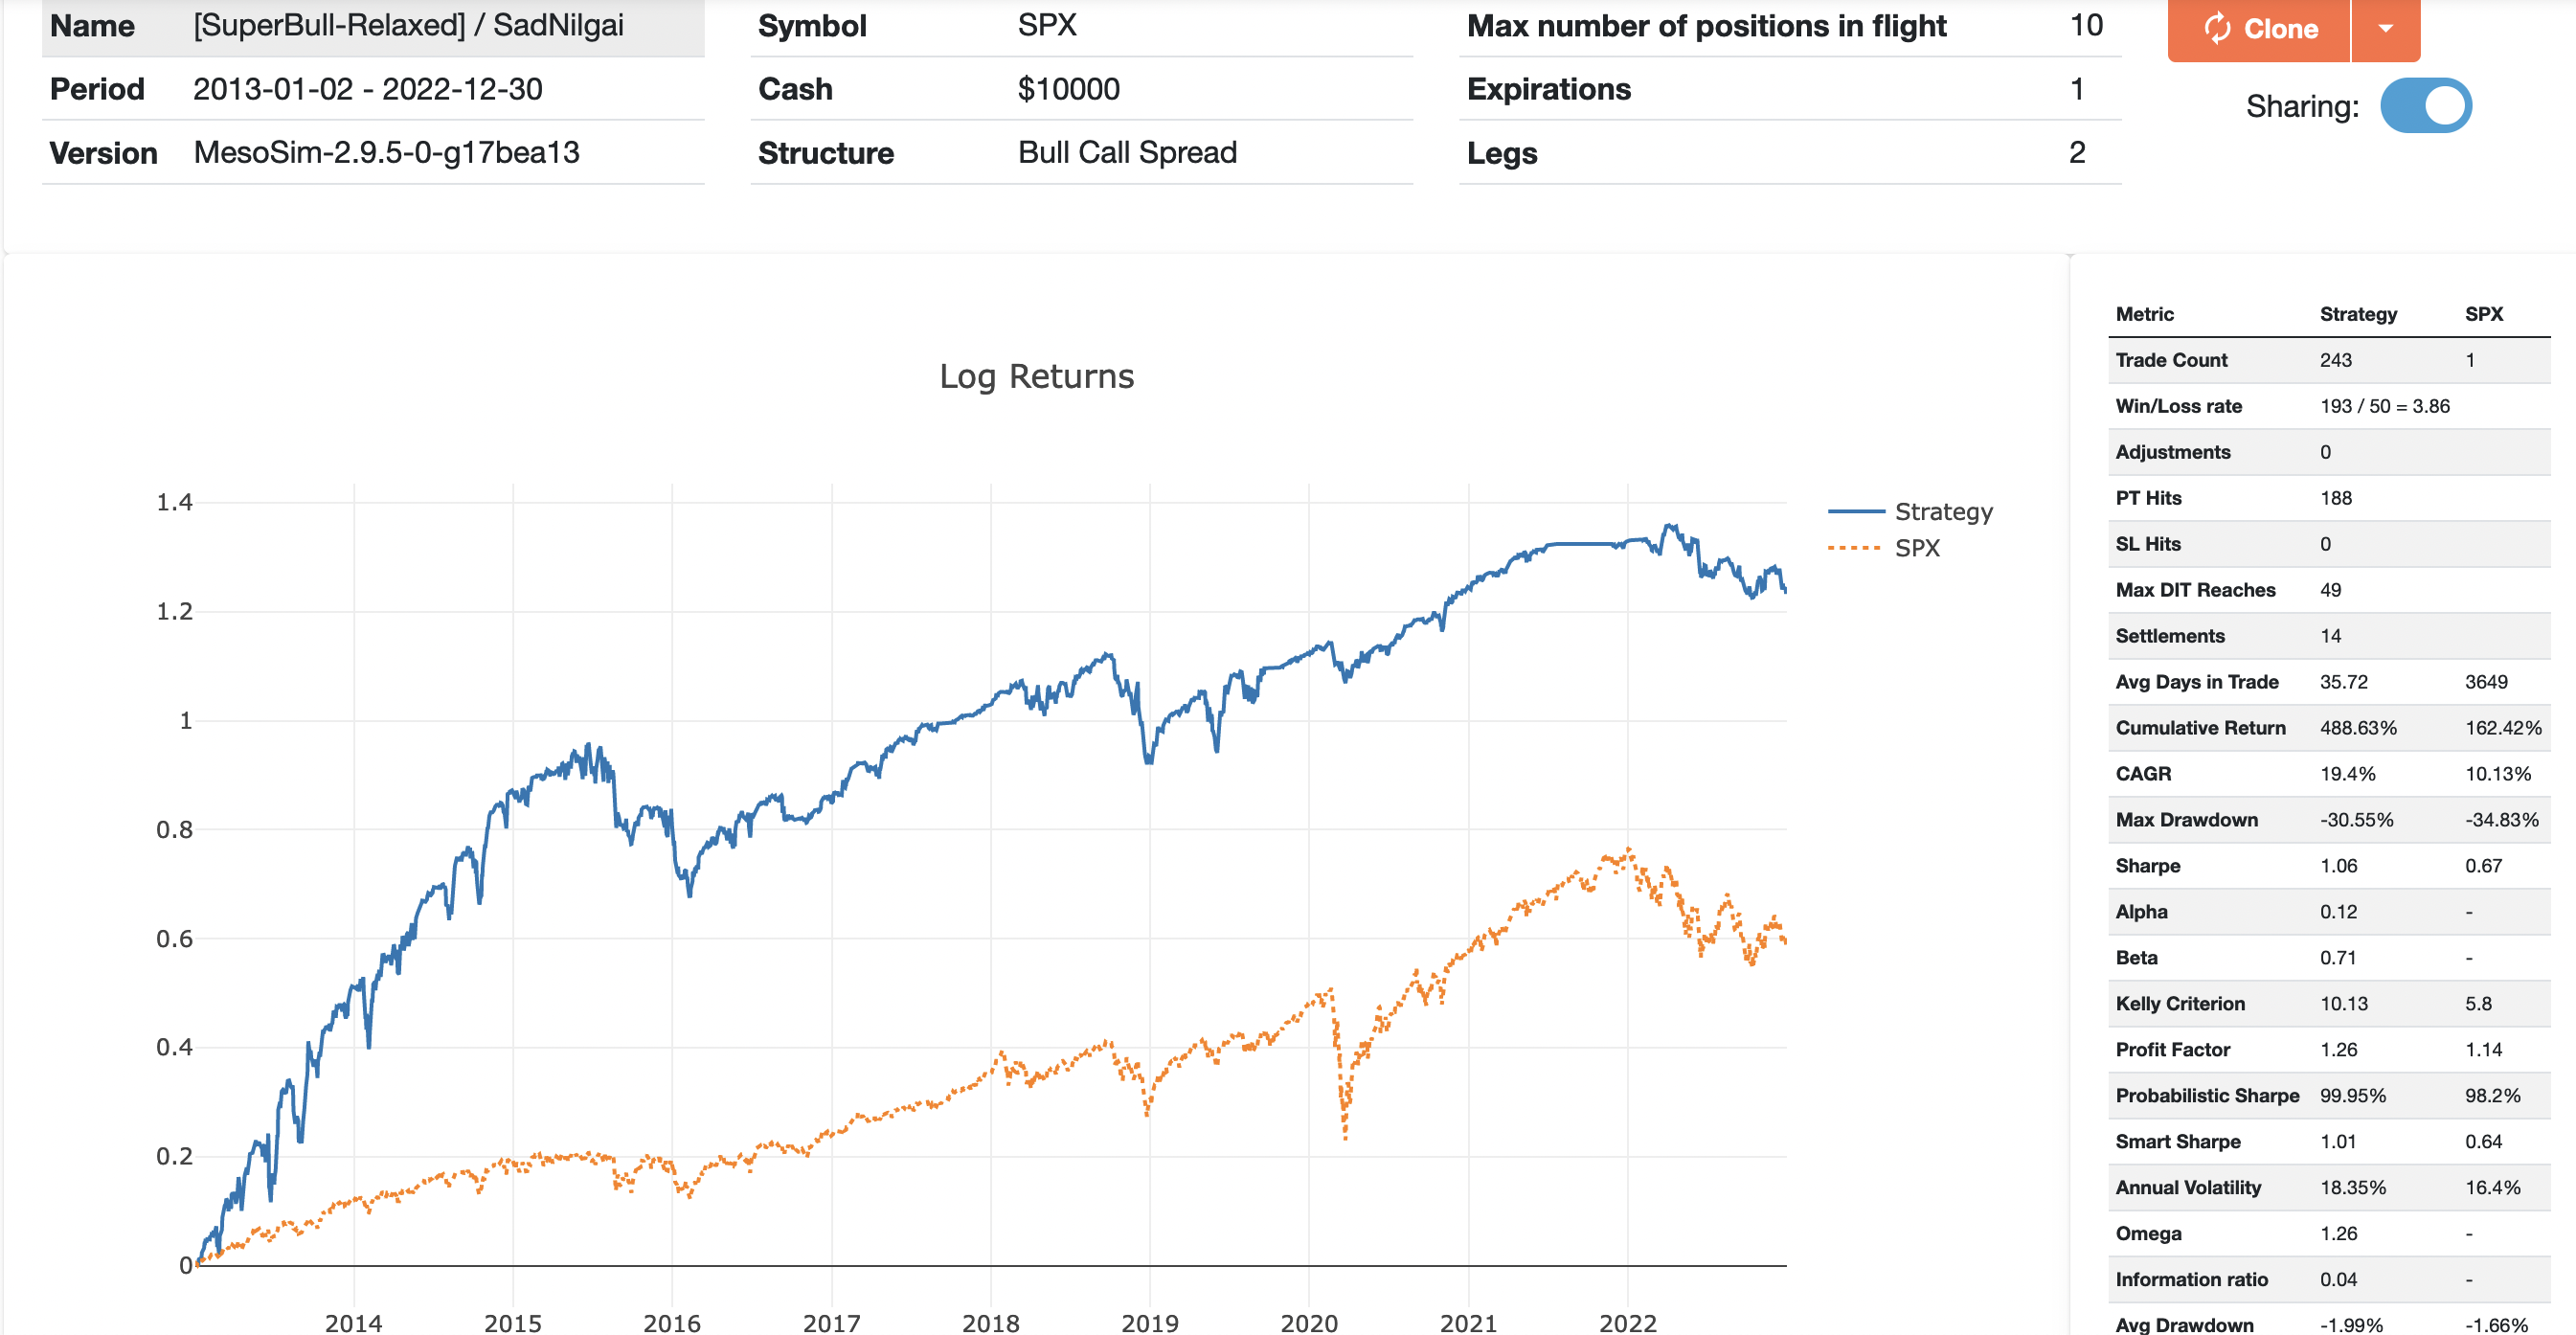
You can access the MesoSim run here:
https://portal.deltaray.io/backtests/5cc071d8-d9c1-43c0-8107-644de848dcdc
His results are improving the original trade by having higher CAGR, reduced Drawdown, (and therefore) improved Sharpe:
- CAGR: 19.4% vs 16.7%
- Max Drawdown: 30.55% vs 34.06%
- Sharpe: 1.06 vs 0.89
Similar to the original trade, the Relaxed SuperBull also excels in bull markets and
it has outstanding performance in the 2013-2014 period.
Due to its more dynamic exit criteria and re-entry rules, it responds fairly well to crashes, such as COVID.
However, unlike the other trade, this variant demands more attention from the trader as the entries and exits are more frequent and dynamic compared to the original strategy.
Thanks and final note
Both Rafael and ourselves believe that John's trade is worth studying.
None of us is affiliated with John in any way.
We would like to thank John Locke and Rafael Munhoz for sharing the SuperBull and the SuperBull-Relaxed trades with the options trading community!